



Okta provides cloud-based identity and access management for employees, customers, applications and, increasingly, AI agents. Organizations use its platform to manage workforce sign-ins, automate access permissions and secure customer authentication across cloud and on-premises environments. In practice, enterprises can use Okta to connect employees with thousands of business applications through single sign-on, while development teams can use Auth0 to add authentication and authorization to websites, mobile apps and digital services.
The company’s scale continues to expand. Okta reported more than 20,000 customers as of Jan. 31, 2026, while fiscal 2026 revenue reached $2.919 billion and subscription revenue accounted for roughly 98% of total sales. At the same time, demand for stronger authentication, phishing-resistant access and AI-agent governance is creating new use cases across industries. These Okta statistics examine the company’s adoption, revenue, spending, workforce, security trends, product usage and growth outlook.
Editor’s Choice
- Okta’s fiscal 2026 revenue reached $2.919 billion, representing 12% year-over-year growth from $2.610 billion.
- Fiscal 2026 marked a major profitability improvement: GAAP operating income reached $149 million, compared with a $74 million operating loss in fiscal 2025.
- GAAP net income climbed from $28 million in fiscal 2025 to $235 million in fiscal 2026, an increase of more than eightfold.
- Subscription revenue reached $2.855 billion in fiscal 2026, up 12% from $2.556 billion in fiscal 2025.
- First-quarter fiscal 2027 revenue reached $765 million, up 11% from $688 million in the comparable 2025 quarter.
- Okta’s large-customer count continued expanding in 2026, with 5,180 customers above $100,000 in ACV as of April 30, versus 4,870 a year earlier.
- The company’s fiscal 2027 revenue outlook stood at $3.185 billion to $3.205 billion after its first-quarter results, implying 9% to 10% annual growth.
- Okta’s board authorized a $1 billion share repurchase program in January 2026. By April 30, the company had repurchased about 3.03 million shares for $241 million during the first fiscal quarter.
- A 2026 third-party SSO technology dataset estimates Okta at 33.99% market share, with 26,624 tracked customers, ranking it No. 2 among the products in that dataset.
Recent Developments
- Okta authorized up to $1 billion in Class A common stock repurchases in January 2026, introducing a significant capital-return program alongside its continued product investments.
- During the quarter ended April 30, 2026, Okta spent $241 million repurchasing and retiring 3,026,820 Class A shares. The filing reported $680 million remaining under the authorization at quarter-end.
- Okta expanded Okta for AI Agents in May 2026 so that it could work with any identity provider and govern access to enterprise resources, while adding support for agents built on Amazon Bedrock AgentCore.
- In June 2026, Okta introduced agent-to-agent connection controls that let administrators define invocation policies, resource scope and session duration for AI agents.
- The Cross App Access ecosystem had more than 25 early adopters by June 2026, including enterprise software, infrastructure and AI companies.
- Okta expanded its collaboration with Google Cloud in June 2026 to extend identity security controls across AI agents, users, access and devices.
- Also in June, Okta became a featured identity provider for Anthropic’s Claude beta program for secure AI-agent connections. The program included application access involving tools such as Asana, Atlassian, Canva, Figma and Linear.
- Okta’s 2026 workplace research found that 82% of surveyed businesses reported only limited-to-moderate AI-agent adoption, highlighting how early the enterprise agent market remains.
- The same research found that 58% identified AI governance and identity and access management as a top concern, showing why Okta has shifted product development toward nonhuman identities.
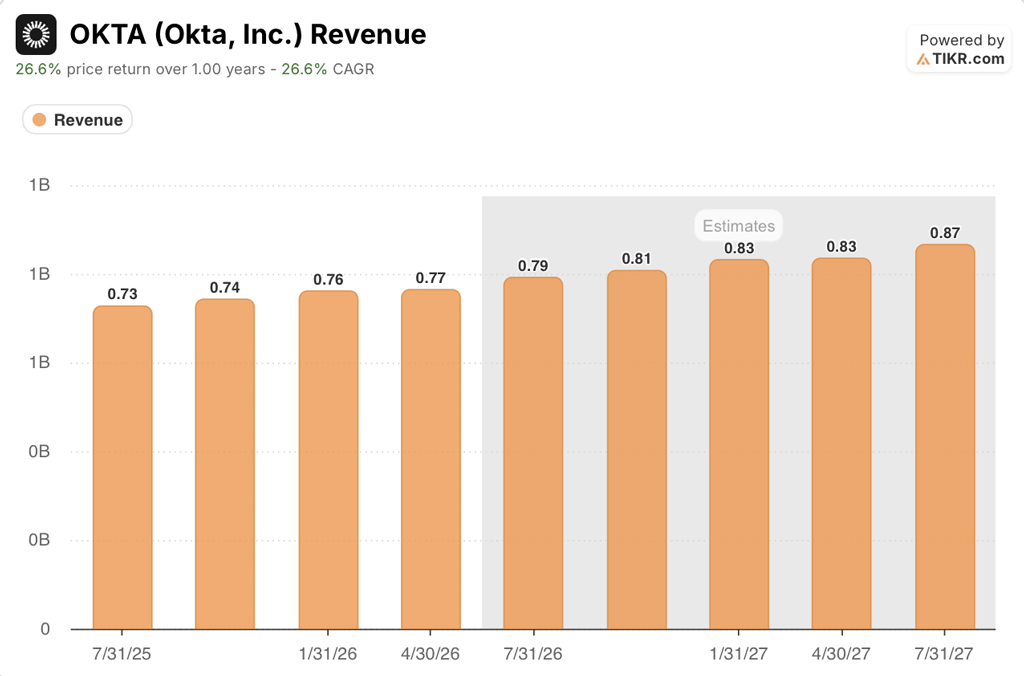
Okta Revenue Growth and Forecast
- Okta’s quarterly revenue stood at $0.73 billion on July 31, 2025, providing the starting point for the upward revenue trend shown in the data.
- Revenue increased to $0.74 billion by October 31, 2025, before climbing further to $0.76 billion by January 31, 2026.
- By April 30, 2026, Okta’s quarterly revenue reached $0.77 billion, representing growth of about 5.5% from July 2025.
- Revenue is estimated to rise to $0.79 billion by July 31, 2026 and $0.81 billion by October 31, 2026.
- Okta’s quarterly revenue is projected to reach $0.83 billion by January 31, 2027 and remain at approximately $0.83 billion in April 2027.
- By July 31, 2027, quarterly revenue is forecast to hit $0.87 billion, the highest figure displayed in the chart.
- Overall, the figures indicate an increase from $0.73 billion to $0.87 billion, representing approximately 19.2% growth across the displayed period.
Okta Market Share and Adoption
- Okta’s share of the tracked single sign-on market is estimated at 33.99%, based on 26,624 detected customer organizations.
- The platform ranks No. 2 among 22 tracked SSO technologies, trailing only the category’s leading product by detected install base.
- A broader dataset identifies 34,111 companies using Okta within the identity and access management category.
- The company officially reported having more than 20,000 contracted customers globally as of Jan. 31, 2026.
- Okta’s reported customer base grew from 19,650 on Jan. 31, 2025 to over 20,000 one year later.
- Customers exceeding $100,000 in ACV increased by 6.3%, growing from 4,800 in January 2025 to 5,100 in January 2026.
- By April 2026, this large-customer figure reached 5,180, representing 6.4% year-over-year growth from 4,870 in April 2025.
- Adoption reveals a strong U.S. concentration with 17,366 detected customers, compared to 1,496 in the U.K. and 1,019 in Canada.
- The Okta Integration Network lists more than 8,000 integrations, including 7,786 for SSO and over 900 for lifecycle management.
Okta Subscription vs Professional Services Revenue
- Subscription revenue generated $2.855 billion in fiscal 2026, compared with $2.556 billion in fiscal 2025 and $2.205 billion in fiscal 2024.
- Professional services and other revenue reached $64 million in fiscal 2026, up from $54 million in fiscal 2025.
- As a result, subscriptions represented roughly 97.8% of fiscal 2026 revenue, reinforcing Okta’s recurring-revenue SaaS model.
- Professional services and other activities represented only about 2.2% of fiscal 2026 revenue.
- In Q1 fiscal 2027, subscription revenue totaled $750 million, while professional services and other revenue contributed $15 million.
- Subscriptions consequently accounted for 98% of Q1 fiscal 2027 revenue, the same proportion as in the comparable quarter a year earlier.
- Professional services revenue was effectively flat year over year in Q1, at about $15 million, while subscription revenue grew 11%.
- The economics of the two businesses differ sharply. Q1 fiscal 2027 subscription gross margin stood at 80%, while professional services and other gross margin was negative 33%.
- Okta expects professional services revenue to decline as it shifts more implementation work to partners. Its fiscal 2027 outlook estimates that this transition will reduce total revenue growth by roughly 1 percentage point.
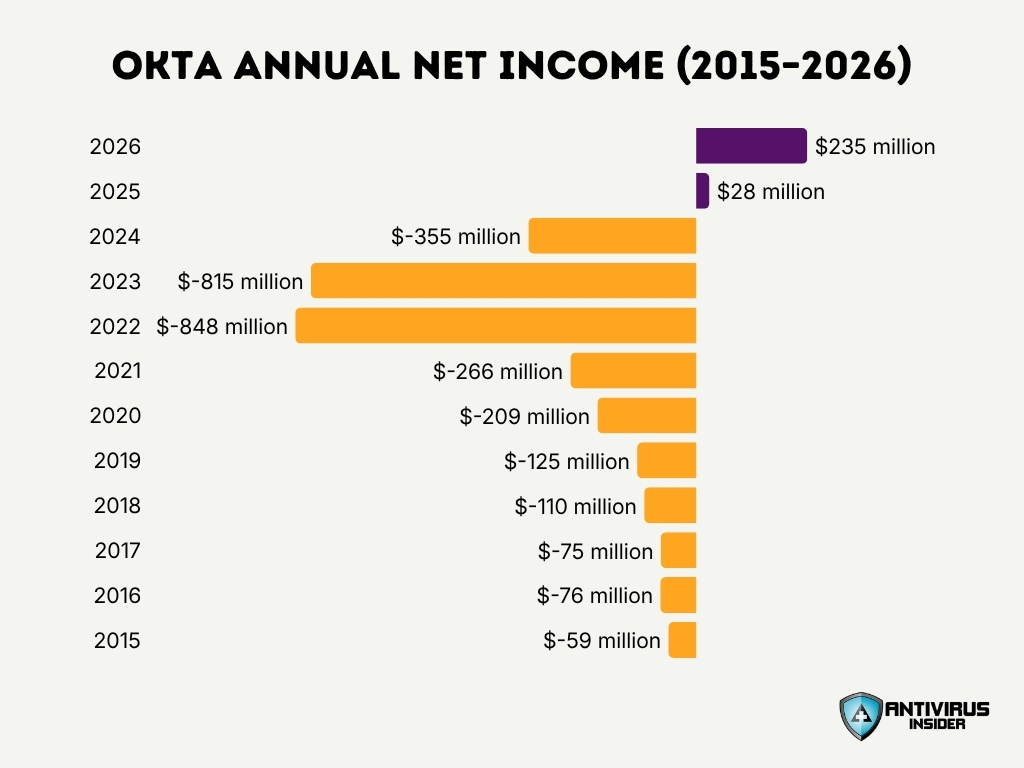
Okta Annual Net Income Statistics
- Okta reported an annual net income of $235 million in 2026, its strongest result in the dataset.
- In 2025, Okta recorded a $28 million net profit, marking a significant turnaround from previous annual losses.
- Okta posted a net loss of $355 million in 2024, improving substantially from the $815 million loss in 2023.
- The company’s largest annual loss in the period occurred in 2022, when net losses reached $848 million.
- Okta’s net loss narrowed slightly from $848 million in 2022 to $815 million in 2023, before improving sharply in subsequent years.
- Between 2015 and 2024, Okta recorded net losses every year in the provided dataset.
- Okta moved from a $355 million loss in 2024 to a $28 million profit in 2025, a year-over-year improvement of $383 million.
- Net income then increased by another $207 million, rising from $28 million in 2025 to $235 million in 2026.
- Compared with its $848 million loss in 2022, Okta’s $235 million profit in 2026 represents a $1.08 billion improvement in annual net income.
- Overall, the data shows a major profitability turnaround, with Okta progressing from persistent annual losses to positive net income in 2025 and 2026.
Okta Operating Expenses
- Okta recorded $2.109 billion in total operating expenses in fiscal 2026, up from $2.066 billion in fiscal 2025 but below the $2.198 billion reported in fiscal 2024.
- Sales and marketing remained the largest expense category at $1.018 billion in fiscal 2026, compared with $965 million in fiscal 2025.
- Research and development expenses totaled $639 million in fiscal 2026, slightly below $642 million in fiscal 2025 and $656 million in fiscal 2024.
- General and administrative expenses remained essentially flat at $448 million in both fiscal 2026 and fiscal 2025.
- Restructuring and other charges declined from $11 million in fiscal 2025 to $4 million in fiscal 2026, compared with $56 million in fiscal 2024.
- In Q1 fiscal 2027, total operating expenses reached $539 million, up from $494 million in the comparable 2025 quarter.
- Q1 research and development expenses increased 6% to $163 million, driven partly by $11 million more in labor costs and $3 million more in hosting expenses.
- Q1 sales and marketing spending climbed 18% to $278 million, with higher labor, marketing and travel costs contributing to the increase.
- General and administrative expense moved in the opposite direction, declining 5% to $98 million in Q1 fiscal 2027 from $103 million a year earlier. Total operating expenses represented 71% of revenue in both periods.
Okta Research and Development Spending
- Okta spent $639 million on research and development in fiscal 2026, compared with $642 million in fiscal 2025. That represents a modest 1% year-over-year decline.
- Research and development accounted for about 22% of fiscal 2026 revenue, down from 25% in fiscal 2025. Revenue growth therefore outpaced R&D spending during the year.
- Okta reduced R&D-related stock-based compensation by $20 million in fiscal 2026, which more than offset several areas of higher spending.
- At the same time, labor costs within R&D increased by $15 million, reflecting continued investment in engineering and product development.
- R&D hosting fees increased by approximately $2 million during fiscal 2026 as Okta continued operating and developing cloud-based identity products.
- Okta’s R&D spending equaled roughly 21.9 cents for every $1 of fiscal 2026 revenue, based on $639 million in R&D expenses and $2.919 billion in total revenue.
- In the first quarter of fiscal 2027, R&D expense increased to $163 million, up about 6% from the comparable prior-year quarter. The increase included roughly $11 million in additional labor costs.
- First-quarter fiscal 2027 R&D spending also included approximately $3 million more in hosting costs, showing that infrastructure expenses remain part of Okta’s product investment strategy.
- Despite nearly flat annual R&D spending, Okta increased fiscal 2026 revenue by 12%, supporting a decline in R&D expense as a percentage of sales.
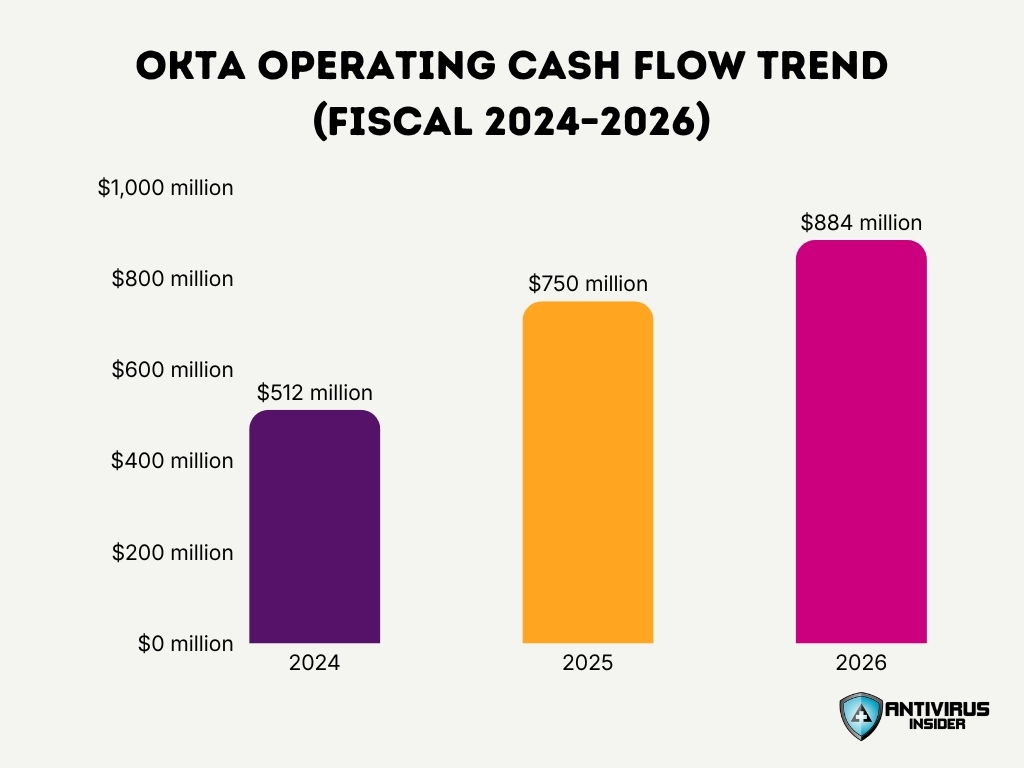
Okta Cash Flow and Financial Position
- Okta generated $884 million in operating cash flow during fiscal 2026, up from $750 million in fiscal 2025 and $512 million in fiscal 2024.
- Fiscal 2026 operating cash flow increased by $134 million, or about 18%, driven primarily by higher customer collections and improved spending efficiency.
- Free cash flow reached $863 million in fiscal 2026, compared with $730 million in fiscal 2025. Its free cash flow margin improved from 28% to 30%.
- Operating cash flow represented approximately 30% of fiscal 2026 revenue, up slightly from 29% during the previous fiscal year.
- Okta held $2.553 billion in cash, cash equivalents and short-term investments as of Jan. 31, 2026.
- Of its Jan. 31 investment portfolio, approximately $1.695 billion consisted of short-term investments, including U.S. Treasury securities, corporate debt securities and certificates of deposit.
- About $1.387 billion of Okta’s short-term investments had contractual maturities within one year, while another $308 million were due within one to five years.
- In Q1 fiscal 2027, operating cash flow increased to $277 million, compared with $241 million in Q1 fiscal 2026. Free cash flow rose from $238 million to $271 million.
- Okta’s Q1 fiscal 2027 free cash flow margin held at 35%, while cash, cash equivalents and short-term investments increased to $2.589 billion as of April 30, 2026.
- Fiscal 2026 investing activities generated $271 million in net cash, compared with a $314 million use of cash in fiscal 2025, largely because maturities and redemptions of securities exceeded new investment purchases.
Okta Sales and Marketing Expenses
- Okta’s sales and marketing expenses reached $1.018 billion in fiscal 2026, up from $965 million in fiscal 2025.
- Sales and marketing spending increased by $53 million, or 5%, year over year, making it Okta’s largest operating expense category.
- Despite the higher dollar amount, sales and marketing expenses declined from 37% of revenue in fiscal 2025 to 35% in fiscal 2026 because revenue grew faster than spending.
- Labor costs contributed approximately $23 million to the fiscal 2026 increase in sales and marketing expenses.
- Marketing program costs increased by approximately $12 million, while travel and entertainment expenses increased by another $8 million.
- Software-related sales and marketing costs increased by about $2 million, and stock-based compensation rose by approximately $1 million.
- For every $1 in fiscal 2026 revenue, Okta spent approximately 35 cents on sales and marketing, down from about 37 cents a year earlier.
- First-quarter fiscal 2027 sales and marketing expenses increased 18% year over year to $278 million, signaling a faster pace of go-to-market investment entering 2026.
- Okta expects sales and marketing to remain its largest operating expense category while gradually declining as a percentage of revenue if the company continues scaling efficiently.
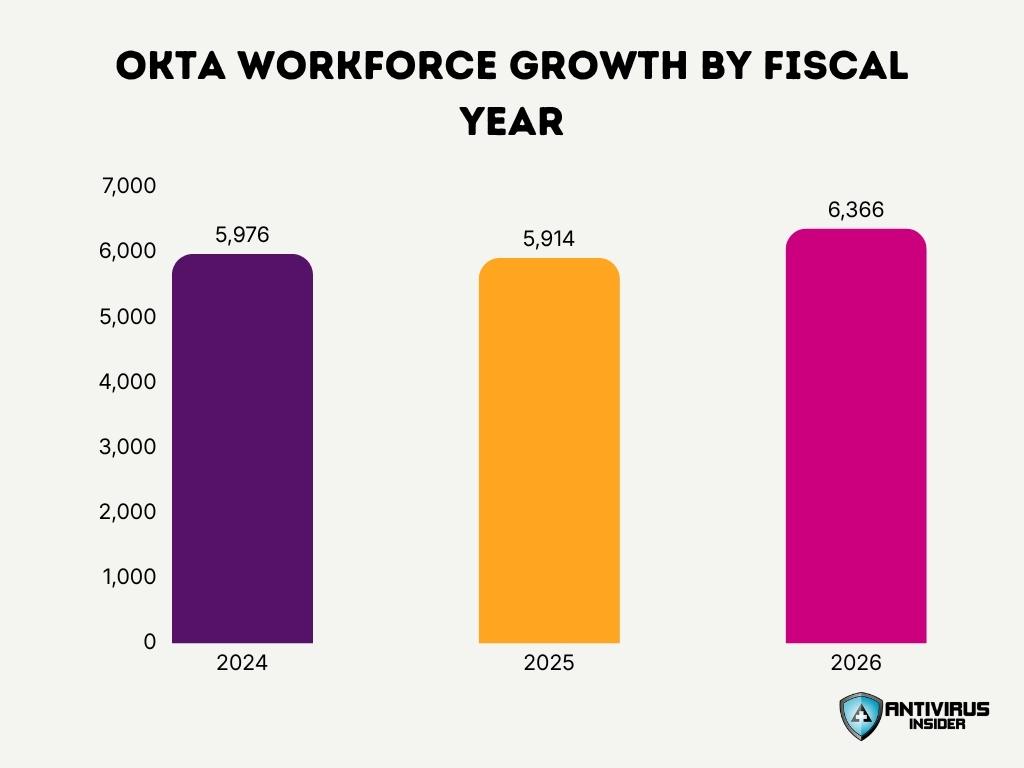
Okta Workforce Growth and Employee Trends
- Okta’s employee count reached 6,366 in fiscal 2026, the highest level recorded across the three-year period.
- The workforce increased by 452 employees from 5,914 in 2025 to 6,366 in 2026, representing growth of approximately 7.6%.
- In fiscal 2025, Okta’s workforce declined slightly to 5,914 employees, down from 5,976 in 2024.
- The 2025 decline amounted to just 62 employees, or approximately 1.0%, indicating relatively stable staffing during the year.
- Overall, Okta added 390 employees between fiscal 2024 and 2026, expanding its workforce by approximately 6.5%.
Okta Stock Performance
- Okta shares traded at approximately $150.33 at the latest available market reading on Aug. 11, 2026.
- The stock’s 52-week high stood at $157.00, putting the latest price about 4% below its annual peak.
- Okta’s 52-week low was $62.66, meaning the Aug. 11 price stood roughly 140% above that low.
- Okta stock had gained more than 70% during 2026 by early August, substantially outperforming many software companies over the same period.
- By July 31, 2026, Okta’s reported year-to-date total return was approximately 62.8%.
- In mid-July 2026, Okta reached an intraday price of $157.00, matching its current 52-week high.
- The stock closed at $147.74 on July 16, 2026, compared with the current level near $150, showing that shares remained close to their summer highs entering August.
- Okta’s all-time closing high remains $291.78, reached in February 2021, meaning the 2026 recovery has not yet returned the stock to its pandemic-era peak.
- At the latest market reading, Okta had a market capitalization of approximately $26.7 billion, placing its equity value at more than nine times fiscal 2026 revenue.
- Okta has not completed a traditional stock split since becoming publicly traded, so historical share-price comparisons do not require adjustment for split events.
Okta Fiscal Year Performance Highlights
- Okta generated $2.919 billion in fiscal 2026 revenue, representing 12% growth from $2.610 billion in fiscal 2025.
- Subscription revenue reached $2.855 billion, also rising 12% year over year and representing approximately 98% of total revenue.
- GAAP operating income improved to $149 million in fiscal 2026, compared with a $74 million operating loss in fiscal 2025. The GAAP operating margin improved from negative 3% to positive 5%.
- Non-GAAP operating income increased to $766 million, up from $587 million in fiscal 2025, while the non-GAAP operating margin expanded from 22% to 26%.
- GAAP net income reached $235 million, versus just $28 million in fiscal 2025 and a $355 million net loss in fiscal 2024.
- GAAP diluted earnings per share rose to $1.31 in fiscal 2026, compared with $0.06 in the previous fiscal year.
- Non-GAAP net income increased to $646 million, up 27% from $510 million in fiscal 2025. Non-GAAP diluted EPS increased from $2.81 to $3.50.
- Fiscal 2026 free cash flow totaled $863 million, an increase of $133 million from fiscal 2025, while free cash flow margin expanded to 30%.
- Subscription gross margin improved from 79% to 80%, while total gross margin increased from 76% to 77% during fiscal 2026.
- The positive trend extended into Q1 fiscal 2027: revenue grew 11% to $765 million, GAAP operating income rose to $56 million and GAAP net income increased to $74 million.
Okta Customer Base and Industry Usage
- Okta served more than 20,000 customers worldwide at the end of fiscal 2026, spanning private companies, public-sector organizations, nonprofits and educational institutions.
- The number of customers generating more than $100,000 in annual contract value reached 5,180 by April 30, 2026, up from 4,870 one year earlier. This represents roughly 6% year-over-year growth in the large-customer segment.
- Customers with at least $1 million in annual contract value grew 20% year over year in the first quarter of fiscal 2026, making this Okta’s fastest-growing customer cohort at that point.
- Okta’s dollar-based net retention rate reached 107% as of April 30, 2026, up from 106% at the end of fiscal 2026. The figure indicates that existing customers collectively increased their spending after accounting for contractions and churn.
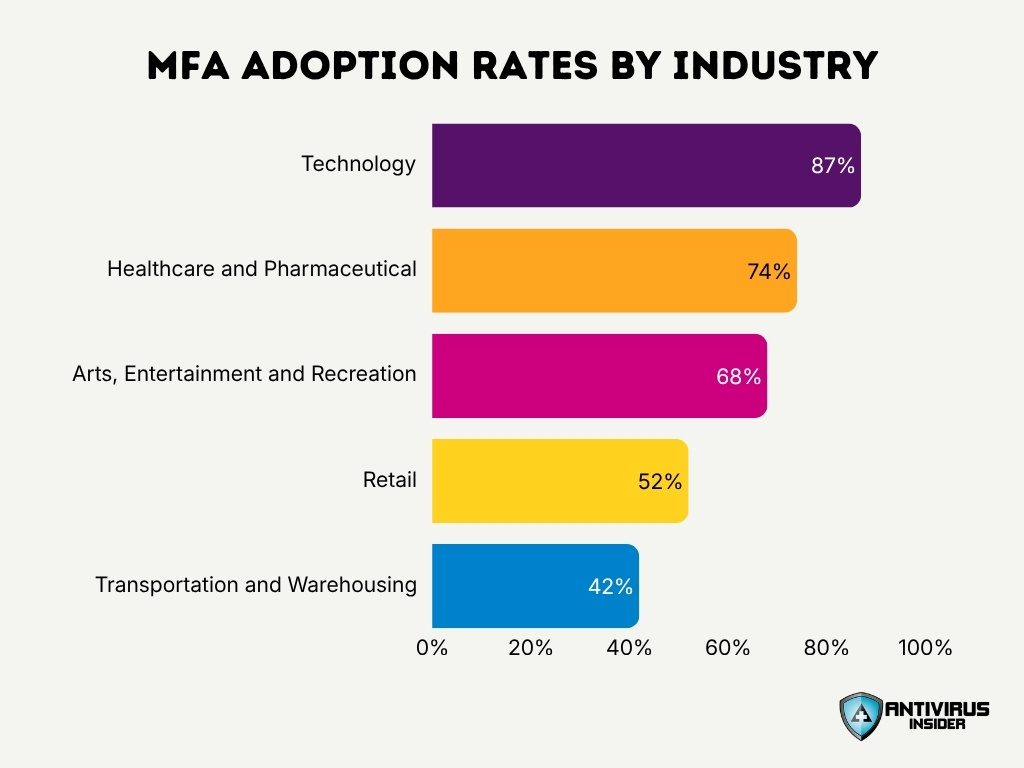
- Technology companies recorded the highest MFA adoption among measured industries at 87% of users, underscoring the sector’s early adoption of advanced identity controls.
- Healthcare and pharmaceutical organizations increased MFA adoption from 70% to 74% in the latest measurement period, a 4-percentage-point improvement.
- Retail organizations increased MFA adoption from 43% to 52%, the largest year-over-year increase among the industries highlighted in the latest secure sign-in dataset.
- Arts, entertainment and recreation organizations increased MFA adoption from 63% to 68%, showing broader adoption outside traditionally security-heavy industries.
- Transportation and warehousing remained an adoption laggard, with MFA protecting only 42% of users, compared with adoption rates of 60% to 80% across most industries.
- Nonprofits represent an increasingly important identity-security use case. Their detected threat-to-authentication ratio reached 78% in 2026, making them the most-targeted industry in the latest dataset.
Okta Geographic Distribution of Users
- The United States accounted for approximately 80% of total fiscal 2026 revenue.
- International revenue represented 20% of total revenue in fiscal 2026, down from 21% in fiscal 2025.
- Based on $2.919 billion total revenue, the United States generated approximately $2.34 billion.
- International markets supplied roughly $584 million in revenue for fiscal 2026.
- International revenue experienced a 14% year-over-year growth during fiscal 2025.
- MFA adoption across the Asia-Pacific region increased by 7 percentage points from 61% to 68%.
- Hong Kong recorded a sharp improvement in MFA adoption, climbing from 62% to 81%.
- South Korea saw its MFA adoption rise from 63% to 80% in a single year.
- Japan increased its MFA adoption rate from 53% to 62%.
- Approximately 44% of the 6,366 total employees worked outside the United States as of Jan. 31, 2026.
Okta Security and Threat Insights
- Overall workforce MFA adoption reached 70% of users in the latest secure sign-in dataset, continuing a steady rise from 50% in early 2020 and 64% in January 2023.
- Adoption of phishing-resistant authenticators increased 63% in one year, rising from 8.6% to 14.0% of users. These authenticators include FastPass, WebAuthn and smart cards.
- The nonprofit sector’s threat-to-authentication ratio surged to 78% in 2026, compared with 18% one year earlier and just 2.6% two years earlier.
- Wholesale trade ranked second in the latest industry threat analysis, with detected threats equal to 44% of authentications.
- Energy, mining, oil and gas followed with a 29% threat-to-authentication ratio, highlighting meaningful identity risk in critical infrastructure industries.
- Tycoon 2FA phishing detections peaked at 11,199 attempts in July 2025 against Microsoft customers federating identity through Okta. That monthly figure exceeded the previous three months combined.
- Tycoon 2FA detections fell to 5,982 in August 2025 and then to 885 in the month before a March 2026 law-enforcement disruption.
- Despite that disruption, 1,470 Tycoon 2FA phishing attempts were detected through the end of March 2026, followed by another 631 detections in April.
- In a real-world deployment covering nearly 5,000 employees, FastPass and Identity Threat Protection produced 99.6% phishing-resistant coverage and reduced authentication time by 90%.
- In observed VoidProxy attacks, account takeovers succeeded against users relying on non-phishing-resistant MFA, while FastPass prevented all observed account-takeover attempts in that analyzed attack set.
Okta Product and Platform Usage Statistics
- MFA now protects 70% of measured workforce users, making multifactor authentication one of the clearest indicators of identity-platform adoption across Okta environments.
- Phishing-resistant authentication adoption reached 14.0% of users, up from 8.6% a year earlier. This category combines FastPass, WebAuthn and smart-card authentication.
- The 5.4-percentage-point increase in phishing-resistant usage translates into a 63% year-over-year growth rate, considerably faster than overall MFA adoption growth.
- Among organizations with 1,250 to 3,999 employees, MFA adoption rose from 74% to 77%, indicating improving deployment at midsize and larger enterprises.
- Organizations with roughly 4,000 to 19,999 employees increased MFA adoption from 67% to 71%, narrowing part of the historical authentication gap between smaller and larger employers.
- Okta’s subscription products generated $750 million of Q1 fiscal 2027 revenue, representing 98% of the company’s $765 million quarterly total and reflecting the scale of its recurring platform model.
- Q1 fiscal 2027 subscription revenue increased 11% year over year, from $673 million to $750 million, driven by additional users, new solutions purchased by existing customers and new customer additions.
- Subscription gross margin remained 80% in Q1 fiscal 2027, even as hosting costs increased by $8 million, illustrating the economics of the cloud platform at its current scale.
- In enterprise AI, 91% of surveyed organizations reported using AI agents, but only 10% had developed a mature strategy for governing the nonhuman identities those agents create.
- Among organizations using AI agents, 81% use them to automate repetitive tasks, 65% apply them to customer service and 60% use them to improve internal workflows. These applications increasingly require identity controls for machine access to corporate systems.
Okta for Good Fund Grantmaking and Impact Highlights
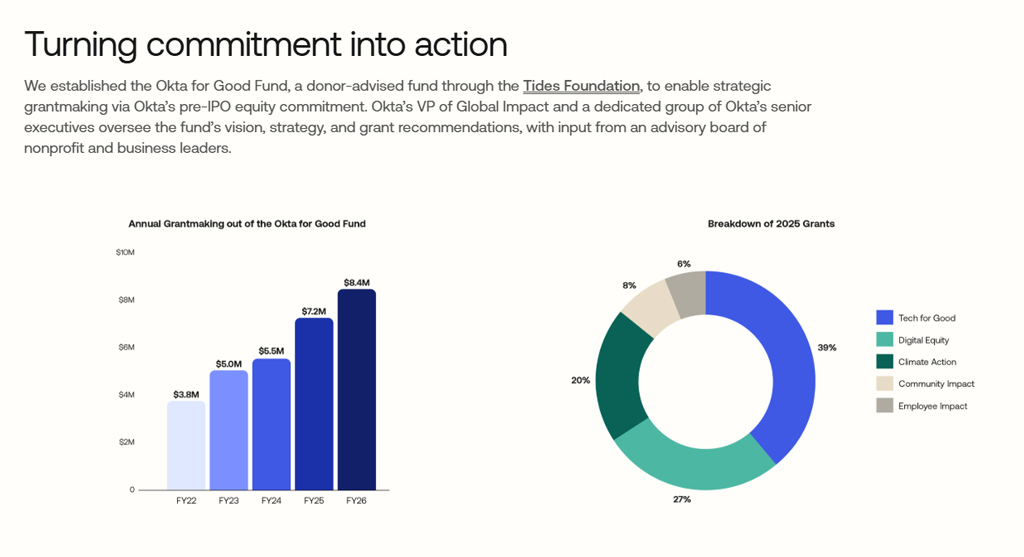
- Okta for Good Fund’s annual grantmaking increased from $3.8 million in FY22 to $8.4 million in FY26, representing growth of more than 121% over the period.
- Annual grants reached $5.0 million in FY23 and climbed further to $5.5 million in FY24, showing consistent year-over-year growth.
- Grantmaking rose sharply to $7.2 million in FY25, an increase of approximately 31% compared with FY24.
- In FY26, funding reached a new high of $8.4 million, up $1.2 million or nearly 17% from FY25.
- In the 2025 grant breakdown, Tech for Good received the largest share at 39%, making technology-focused initiatives the fund’s top priority.
- Digital Equity accounted for 27% of 2025 grants, the second-largest allocation, followed by Climate Action at 20%.
- Community Impact represented 8% of total 2025 grants, while Employee Impact accounted for the remaining 6%.
- Together, Tech for Good and Digital Equity represented 66% of 2025 grant allocations, highlighting Okta’s strong emphasis on technology access and digital initiatives.
Okta Valuation and Key Financial Ratios
- Okta’s equity market capitalization stood at approximately $26.7 billion at the latest available market reading on Aug. 11, 2026.
- With shares around $150.33 and trailing earnings of approximately $1.38 per share, Okta traded at a price-to-earnings ratio of about 109 times earnings.
- Using approximately $2.996 billion in trailing revenue through April 2026, Okta’s current market capitalization implies a price-to-sales ratio near 8.9 times. The trailing figure combines fiscal 2026 revenue with the latest first-quarter change.
- Okta’s fiscal 2026 GAAP operating margin reached 5%, compared with negative 3% in fiscal 2025, marking an 8-percentage-point improvement.
- The company’s fiscal 2026 non-GAAP operating margin reached 26%, four percentage points above the 22% recorded one year earlier.
- Okta’s total gross margin reached 77% in fiscal 2026, while subscription gross margin was higher at 80%.
- Free cash flow margin reached 30% for fiscal 2026 and increased to 35% in the first quarter of fiscal 2027.
- Okta’s $2.553 billion in fiscal year-end liquidity represented approximately 9.6% of its current $26.7 billion market capitalization, giving the company a substantial liquid-asset position relative to its equity value.
- The company’s Q1 fiscal 2027 GAAP operating margin improved to 7%, compared with 6% in the year-earlier quarter, while GAAP net income increased 19% from $62 million to $74 million.
- Management’s latest fiscal 2027 outlook calls for a 25% to 26% non-GAAP operating margin and a 27% to 28% free cash flow margin, indicating that profitability and cash conversion remain central financial targets.
Okta Future Outlook and Growth Projections
- As of Aug. 12, 2026, the latest reported financial guidance remains the guidance issued after first-quarter fiscal 2027 results; second-quarter results are scheduled for Aug. 26, 2026.
- Okta expects fiscal 2027 revenue of approximately $3.185 billion to $3.205 billion, representing projected year-over-year growth of about 9% to 10%.
- At the midpoint of $3.195 billion, the outlook implies roughly $276 million in additional annual revenue compared with fiscal 2026’s $2.919 billion.
- The company expects its shift of professional services engagements toward partners to create an approximately 1-percentage-point headwind to fiscal 2027 total revenue growth.
- Remaining performance obligations stood at $4.719 billion as of April 30, 2026, providing visibility into future contracted subscription revenue.
- Of that backlog, approximately $2.499 billion, or 53%, is expected to convert into revenue within the following 12 months.
- Fiscal year-end RPO had reached $4.827 billion, 15% higher year over year, while current RPO increased 12% to $2.513 billion.
- Continued expansion among existing customers remains another growth lever: the dollar-based net retention rate improved from 106% in January 2026 to 107% in April 2026.
- AI-agent security presents a developing addressable market because 91% of surveyed organizations already use AI agents, while only 10% report a well-developed governance strategy for nonhuman identities.
- International expansion remains another growth opportunity. Only 20% of fiscal 2026 revenue came from outside the United States, leaving Okta substantially more concentrated in its domestic market than its global workforce and product availability might suggest.
Frequently Asked Questions (FAQs)
Okta generated $2.919 billion in fiscal 2026 revenue, up about 12% year over year.
Okta’s Q1 fiscal 2027 revenue reached $765 million, representing 11% year-over-year growth.
One current technology-tracking dataset estimates Okta’s single sign-on market share at approximately 33.83%.
Okta’s current remaining performance obligations reached about $2.499 billion in Q1 fiscal 2027, up 12% year over year.
Workforce MFA adoption reached 70%, while adoption of phishing-resistant authenticators increased 63% in one year.
Conclusion
Okta entered the year with a larger recurring-revenue base, stronger profitability and expanding enterprise adoption. Fiscal 2026 revenue reached $2.919 billion, subscription revenue accounted for roughly 98% of sales, and the company had 5,180 customers above $100,000 in annual contract value by April 2026. Meanwhile, workforce MFA adoption reached 70%, phishing-resistant authenticator adoption grew 63% in a year and AI-agent adoption is creating another identity-security use case. With fiscal 2027 revenue projected at $3.185 billion to $3.205 billion, subscription growth, customer expansion, AI-agent governance and security adoption remain the key statistics to watch.
