


Data breaches remain a persistent business and consumer risk as attackers exploit software vulnerabilities, stolen credentials, third-party access, and human error. The impact extends far beyond exposed personal information. A major breach can interrupt hospital operations, disrupt manufacturing lines, expose financial accounts, compromise customer records, and force organizations to spend millions of dollars on investigation, recovery, and regulatory response. At the same time, cloud adoption, interconnected supply chains and widespread AI use have created new paths for attackers to reach sensitive systems.
Current data shows that breach frequency, financial losses and victim exposure remain high, making faster detection, stronger identity controls and timely vulnerability management increasingly important. The statistics below show how the data breach landscape is changing across attack methods, industries, countries and organizational environments.
Editor’s Choice
- 471.2 million victim notices were issued during the first six months of 2026 in the U.S. tracking dataset, versus roughly 297.5 million during all of 2025.
- H1 2026 produced 1,803 publicly reported data compromises, and Q2 alone contributed 1,029 events, the second-highest quarterly total recorded in the dataset.
- The leading 2026 global breach dataset found that 31% of breaches started with vulnerability exploitation, while credential abuse accounted for 13%.
- 48% of breaches involved ransomware in the latest global analysis, showing that extortion remains embedded in a large share of successful attacks.
- Only 24% of H1 2026 U.S. breach notices disclosed an attack vector, the lowest disclosure rate recorded in that tracking program.
- Supply chain compromises generated 280.6 million victim notices from only 38 initial breaches in H1 2026, illustrating how one vendor compromise can spread across many organizations.
- The global average cost of a breach reached a record $4.99 million in 2026, while organizations using security AI and automation extensively saved an average of $1.93 million compared with organizations using none.
Recent Developments
- Exploitation of vulnerabilities climbed to 31% of breaches in 2026, overtaking stolen credentials as the most common initial-access method in the global dataset.
- Credential abuse fell to 13% of breaches in the same dataset, marking a clear change from previous years when compromised credentials led initial access.
- Organizations fully remediated only 26% of critical known exploited vulnerabilities in 2025, down from 38% in the prior year.
- Median time to fully resolve those critical vulnerabilities increased from 32 days to 43 days, adding roughly 11 days to the exposure window.
- The median organization faced 50% more critical vulnerabilities to patch in the latest reporting period than in the previous one.
- Generative AI now supports approximately 15% of identified attack techniques, including target selection, vulnerability research, and malware development.
- AI-driven attacks increased 56% in 2026, with deepfake impersonation and AI-enabled malware contributing heavily to the growth.
- Zero-day attacks reached 14 events during H1 2026, nearly matching the 17 zero-day incidents recorded during the entire previous year.
- Insider wrongdoing rose to 21 reported events in H1 2026, compared with three during all of 2025, a sevenfold increase.
- Publicly traded companies represented only 10.3% of H1 2026 compromises but accounted for 83.4% of reported victim notices, showing how breach impact can concentrate in large organizations.
Data Breach Statistics Overview
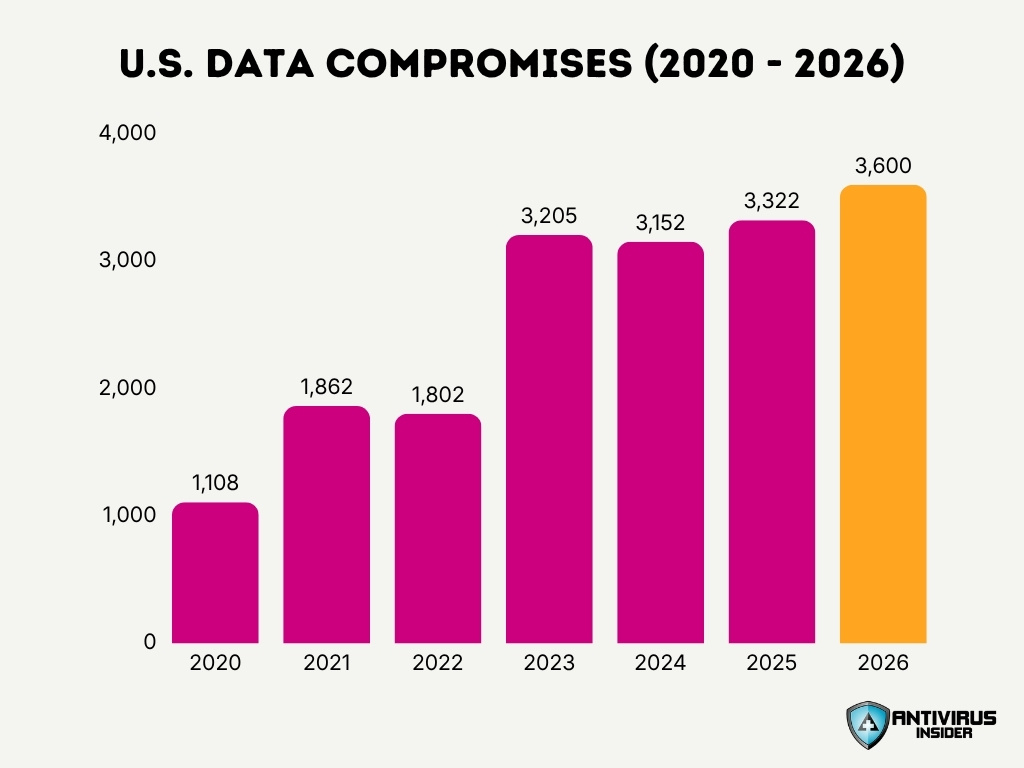
- U.S. tracking recorded 3,322 data compromises in 2025, a 5% increase from 3,152 in 2024 and the highest annual total in that dataset at the time.
- The 2025 total stood 79% higher than five years earlier, illustrating the longer-term rise in publicly reported data compromises.
- Despite the record number of compromises, 2025 generated about 278.8 million victim notices, down 79% from approximately 1.37 billion in 2024.
- In 2025, 70% of breach notices lacked information about how the attack occurred, compared with 65% in 2024 and 45% in 2023.
- A separate consumer survey found that 80% of respondents had received at least one breach notice during the preceding 12 months.
- Nearly 40% of surveyed consumers received three to five separate breach notices within one year.
- Among people who received breach notices, 88% reported at least one negative consequence, such as increased spam, phishing, or attempted account takeover.
- Separately, a 2025-26 business survey estimated that 612,000 businesses in one major national economy experienced some form of cyber breach or attack during the previous year.
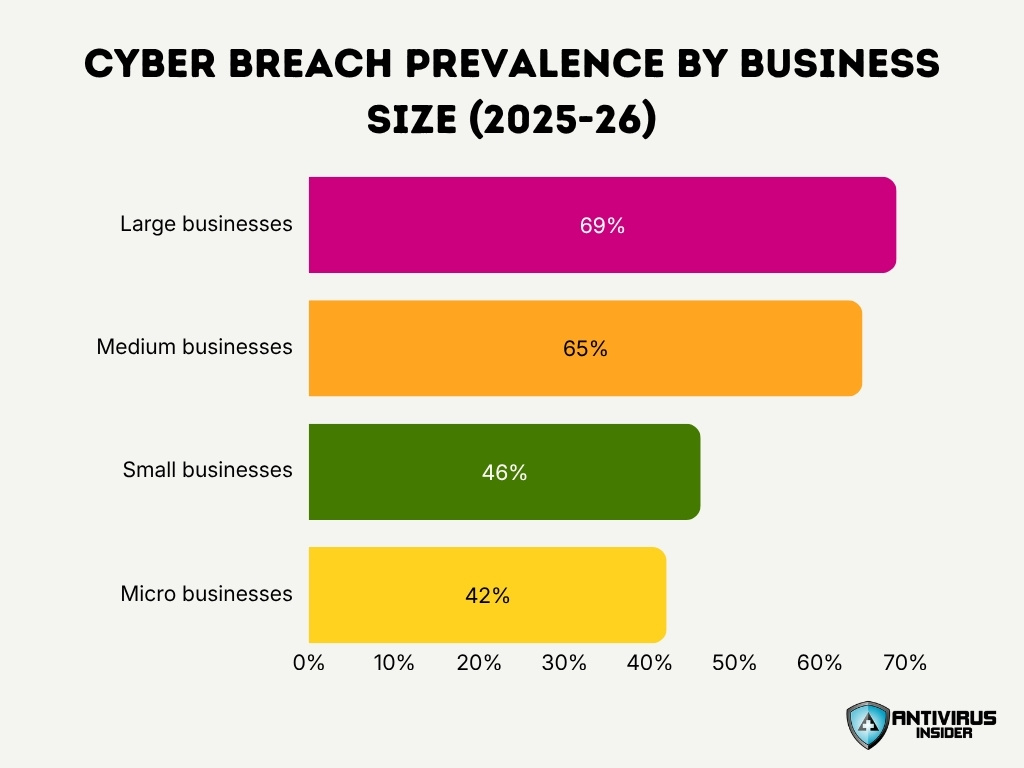
- Breach or attack prevalence increased with business size: 65% of medium businesses and 69% of large businesses reported an incident, versus 42% of micro businesses and 46% of small businesses.
Global Data Breach Statistics
- The 2026 global breach analysis covered organizations across 145 countries, giving the dataset broad geographic reach.
- More than 22,000 confirmed breaches appeared in the latest global dataset, the largest number examined in a single edition of that research.
- In the Asia-Pacific region, researchers analyzed 5,229 incidents and 2,855 confirmed breaches.
- Within that Asia-Pacific dataset, vulnerability exploitation accounted for 42% of initial access, compared with credential abuse at 25% and phishing at 15%.
- Third parties played a role in 69% of Asia-Pacific breaches included in the regional analysis, while a human element appeared in 71%.
- Another large regional group recorded 8,245 security incidents and 6,060 confirmed breaches, reflecting the volume of successful attacks now represented in international datasets.
- A 2026 national survey outside the U.S. found that 43% of businesses and 28% of charities had experienced an identifiable cyber breach or attack in the prior 12 months.
- The same survey estimated that approximately 57,000 charities had experienced a breach or attack, alongside roughly 612,000 businesses.
- Globally, the average organizational cost of a data breach increased 12% year over year to $4.99 million in 2026, reinforcing that breach impact extends well beyond the number of exposed records.
Data Breaches by Year
- In 2020, 1,108 data compromises were recorded in the U.S. dataset.
- In 2021, the total jumped to 1,862 compromises, an increase of more than 68% year over year and a record at the time.
- In 2022, 1,802 compromises were reported, only 60 events below the 2021 record.
- The total surged to 3,205 compromises in 2023, roughly 78% higher than the preceding year’s revised total used in that annual report.
- The 2024 series later recorded approximately 3,152 compromises, keeping annual incident volume close to the prior record.
- In 2025, reported compromises rose to 3,322, establishing another annual high.
- H1 2026 alone produced 1,803 compromises, already exceeding the full-year totals recorded in several years earlier in the decade.
- If the H1 pace continues, 2026 could reach about 3,600 compromises, which would extend the streak of years with more than 3,000 reported events to four. This is a projection rather than a final annual count.
Number of Records Exposed
- H1 2026 generated an estimated 471.2 million victim notices, already substantially above the previous full-year total.
- One education-platform compromise accounted for roughly 275 million notices, or 58% of all H1 2026 notices in the U.S. dataset.
- Supply chain breaches accounted for 280.6 million notices during H1 2026 even though researchers traced them to only 38 initial breach events.
- Manufacturing organizations generated approximately 74 million victim notices in H1 2026, compared with just 1.97 million during all of 2025.
- In 2025, organizations issued 278,827,933 victim notices, the lowest annual total in that tracking series since 2014 despite a record number of compromises.
- The corresponding 2024 count reached about 1.37 billion victim notices, nearly five times the 2025 total.
- Five mega-breaches accounted for more than 1 billion of the roughly 1.35 billion notices issued in 2024, demonstrating how a few events can dominate annual exposure totals.
- In 2023, approximately 353 million victims were reported as affected by data compromises, down about 16% from roughly 425 million in 2022 even though compromise counts rose sharply.
- The 2022 annual dataset estimated about 422 million affected individuals, with a single very large dataset exposure contributing heavily to the annual increase.
- Across the U.S. tracking program since 2005, more than 25,200 compromises have generated nearly 12 billion victim notices and exposed approximately 79 billion records, underscoring the cumulative scale of data exposure.
Data Breach Statistics by Attack Vector
- Software vulnerability exploitation became the leading initial access vector in the 2026 global breach dataset, accounting for 31% of breaches and overtaking stolen credentials.
- Credential abuse ranked second among known initial access methods, accounting for 13% of breaches in the latest global analysis.
- Pretexting, where attackers create a false scenario to manipulate a target, reached 6% of all breaches and became increasingly important as an entry method for extortion attacks.
- Threat actors increased their exploitation of public-facing software and system applications by 44% year over year in the 2026 threat dataset.
- More than half, or 56%, of disclosed vulnerabilities analyzed in the latest threat research required no authentication for successful exploitation, lowering the barrier for attackers.
- Third-party software represented 44.5% of observed cloud initial access during the second half of 2025, compared with only 2.9% during the first half of that year.
- Weak or absent credentials accounted for 27.2% of observed cloud intrusions in H2 2025, down from 47.1% during H1 as software exploitation gained ground.
- Remote code execution represented 13.6% of observed cloud entry activity in H2 2025, nearly five times the 2.9% share recorded during the first half of the year.
Most Common Causes of Data Breaches
- Organizations fully remediated only 26% of critical known exploited vulnerabilities during 2025, down from 38% in the previous reporting period.
- Median time to fully resolve critical exploited vulnerabilities increased to 43 days, compared with 32 days in the prior year.
- The median organization faced 50% more critical vulnerabilities requiring patches in the latest reporting dataset than it did a year earlier.
- Misconfigurations accounted for 21% of observed cloud initial access in H2 2025, although that share declined from 29.4% during H1.
- Exposed sensitive interfaces or APIs represented 4.9% of cloud intrusions in H2 2025, down from 11.8% in the first half of the year.
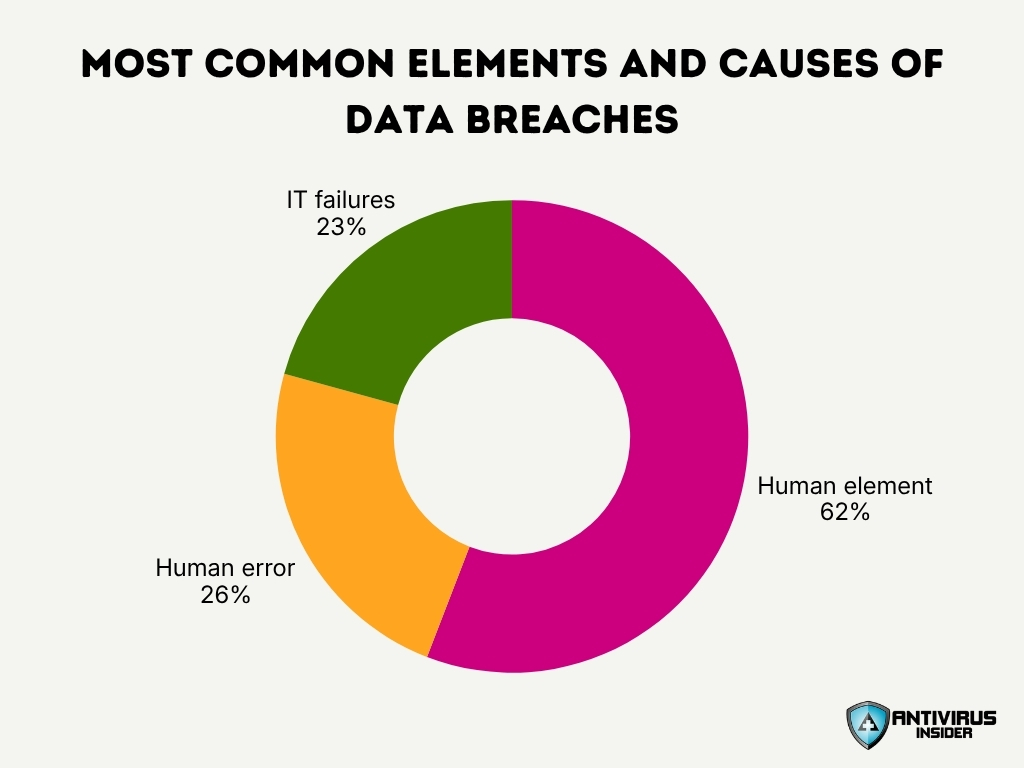
- Organizations reported a human element in 62% of breaches in the 2026 global dataset, up slightly from 60% in the previous year’s analysis.
- Human error accounted for 26% of data breaches in the 2025 cost study, showing that accidental actions remain a material source of exposure alongside malicious attacks.
- IT failures accounted for another 23% of breaches in the 2025 dataset, highlighting the role of system and operational breakdowns that do not begin with a malicious employee.
Data Breaches Caused by Hacking and Stolen Credentials
- Approximately 30% of cyberattacks involved the theft and abuse of valid user accounts.
- Roughly 300,000 AI chatbot credentials were discovered for sale on dark-web markets in 2026.
- Stolen or compromised credentials were responsible for 10% of data breaches during 2025.
- Organizations took up to 186 days to identify breaches initiated via compromised credentials in 2025.
- Only 23% of third-party organizations successfully and fully remediated multifactor authentication weaknesses.
- Half of all identified third-party cloud MFA weaknesses were resolved within one month.
- It took nearly eight months to resolve half of the identified weak cloud passwords and misconfigurations.
- Attempted or successful hacking of online bank accounts affected 8% of breached businesses in 2025-26.
Data Breaches Caused by Human Error and Phishing
- Phishing appeared in 16% of breaches in the 2026 global analysis, unchanged from the previous reporting year.
- Mobile-focused phishing simulations produced median successful click rates 40% higher than email-based simulations, signaling growing risk from text messages and voice-based attacks.
- In the 2025-26 organizational survey, 38% of businesses experienced phishing, down from 42% two years earlier.
- Among businesses that detected at least one cyber breach or attack, 88% encountered phishing attempts, making it by far the most frequently reported attack type in that group.
- Phishing reached 96% of secondary schools that had identified a breach or attack in the 2025-26 education dataset.
- The same 96% phishing rate appeared among further and higher education institutions that identified attacks, compared with 97% in the prior year’s survey.
- Impersonation attacks affected 12% of businesses overall in 2025-26, down from 17% two years earlier.
- Impersonation attempts affected 7% of charities in 2025-26, compared with 11% in 2024-25 and 12% in 2023-24.
- Further and higher education institutions experienced a particularly sharp increase in impersonation activity, with prevalence rising from 68% to 79% year over year.
Insider Threat Data Breach Statistics
- Researchers tracked 21 insider wrongdoing breaches in H1 2026, compared with only three during all of 2025.
- The H1 2026 total represented a sevenfold increase over the entire previous year and exceeded the historical annual level previously observed in that breach-tracking series.
- 67% of employees using unauthorized generative AI services accessed them through non-corporate accounts on company devices, creating visibility and data-governance gaps.
- Regular workplace AI use reached 45% of employees in the latest dataset, up from 15% during the previous year.
- Unauthorized generative AI became the third-most-common non-malicious insider action in the data-loss dataset, with its share increasing fourfold year over year.
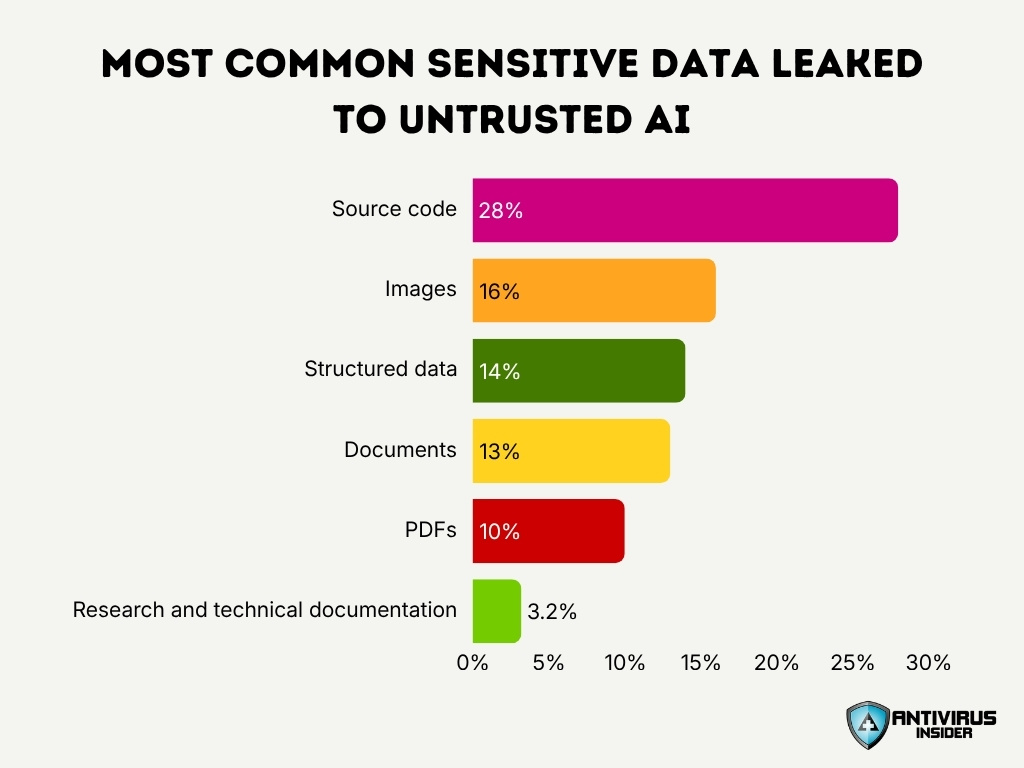
- Source code made up 28% of selected data types submitted to untrusted generative AI systems, making it the most common category in the dataset.
- Images represented 16% of selected data types sent to untrusted AI services, while structured data accounted for another 14%.
- Documents accounted for 13% of selected untrusted AI data events, and PDFs represented another 10%, showing that sensitive business information can leave controlled systems through ordinary employee workflows.
- Research and technical documentation appeared in 3.2% of policy-violating AI submissions, creating a specific risk to intellectual property and proprietary research.
Ransomware and Malware Data Breach Statistics
- Ransomware appeared in 48% of confirmed breaches in the latest global dataset, up from 44% in the previous year’s analysis.
- Despite ransomware’s growing breach share, 69% of ransomware victims did not pay attackers in the latest reporting dataset.
- Among organizations that paid, the median ransom dropped to $139,875, compared with $150,000 in the previous reporting year.
- The number of active ransomware groups increased 49% year over year in the 2026 threat-intelligence analysis, indicating a more fragmented extortion ecosystem.
- Ransomware-related cybercrime affected 1% of businesses in the 2025-26 organizational survey, down from 3% in each of the two preceding survey years.
- The average cost of a ransomware or extortion breach reached approximately $5.08 million in 2025, excluding the value of any ransom payment itself.
- Viruses, spyware and malware excluding ransomware affected 51% of further and higher education institutions that identified a breach or attack in 2025-26, up from 42% a year earlier.
- Among businesses that detected breaches or attacks, 16% encountered viruses, spyware or other non-ransomware malware in the 2025-26 survey.
Third-Party and Supply Chain Breach Statistics
- Third parties played a role in 48% of breaches in the 2026 global dataset, following a 60% year-over-year increase in third-party involvement.
- Supply chain attacks in H1 2026 produced 280.6 million victim notices, demonstrating how a relatively small number of upstream incidents can create widespread downstream exposure.
- Researchers traced those H1 2026 supply chain exposures to only 38 initial breach events, giving each originating incident the potential to affect multiple organizations.
- Those 38 initial breaches ultimately affected 206 entities, meaning the number of organizations exposed was more than five times the number of originating events.
- In observed cloud environments, software-based third-party entry rose from 2.9% in H1 2025 to 44.5% in H2, one of the sharpest changes among documented cloud intrusion vectors.
- Third-party application relationships were implicated in 21% of observed cloud intrusions during 2025, illustrating the exposure created by trusted integrations and connected services.
- Supply chain compromise ranked as the second-most prevalent breach vector in the 2025 cost analysis and generated an average breach cost of approximately $4.91 million.
- Open-source software supply chain threats increased approximately 1,300% over a three-year period in research referenced by the 2025 attack-vector analysis, highlighting growing pressure on package repositories and shared software components.
- Historically, the number of organizations affected by tracked supply chain compromises increased by more than 2,600% from 2018 to 2023, while the estimated number of victims rose about 1,400% over the same period.
Data Breaches by Industry
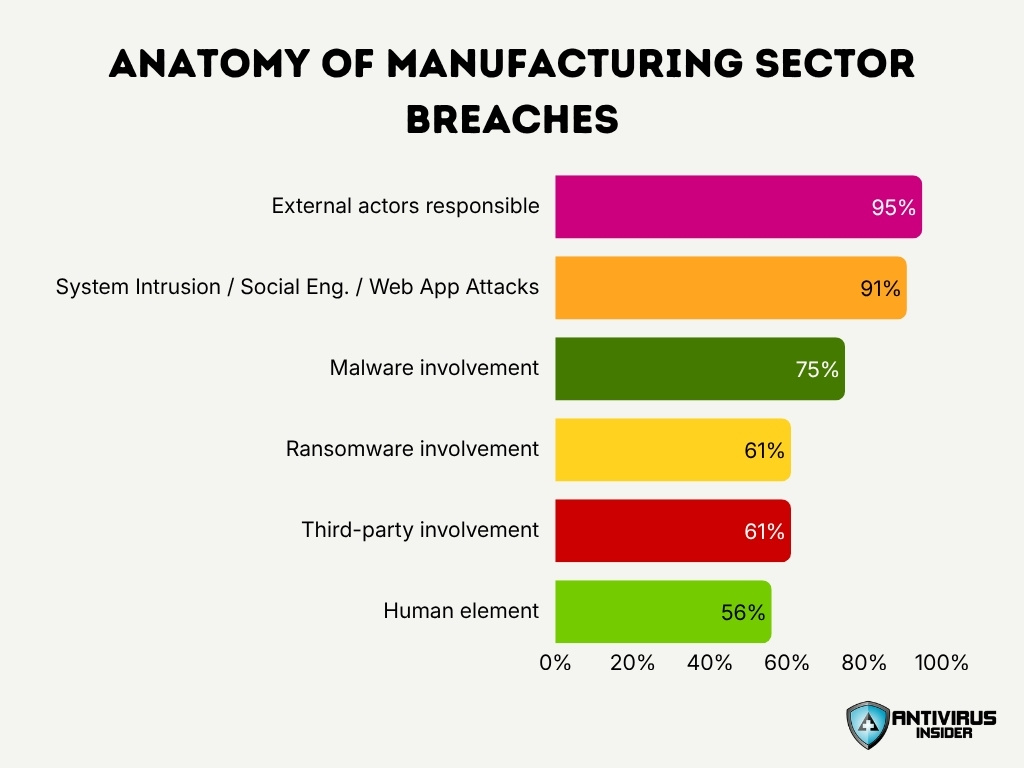
- Manufacturing recorded 2,713 confirmed breaches from 3,627 incidents in the 2026 industry dataset. System Intrusion, Social Engineering and Basic Web Application Attacks accounted for 91% of its breaches.
- Ransomware appeared in 61% of manufacturing breaches, while malware of any type appeared in 75%. This helps explain the continued growth in confirmed breaches across the sector.
- Vulnerability exploitation provided initial access in 38% of manufacturing breaches, followed by phishing at 13% and credential abuse at 11%.
- Third-party involvement appeared in 61% of manufacturing breaches, while a human element appeared in 56%. External actors were responsible for 95% of the sector’s confirmed breaches.
- Healthcare recorded 1,438 confirmed breaches from 1,492 incidents. System Intrusion, Miscellaneous Errors, and Social Engineering represented 81% of healthcare breaches.
- Healthcare breaches involved external actors in 81% of cases, while internal actors appeared in 19%. Financial motives appeared in 99% of breaches where motive information was available.
- The human element appeared in 54% of healthcare breaches, while third-party involvement reached 32%. Personal data appeared in 37% of breaches and credentials in 25%.
- Public administration recorded 2,410 confirmed breaches from 3,634 incidents. Vulnerability exploitation accounted for 40% of known initial access, phishing for 20%, and credential abuse for 8%.
- Retail recorded 806 confirmed breaches from 997 incidents, and its breach count nearly doubled year over year. System Intrusion, Basic Web Application Attacks, and Social Engineering represented 95% of retail breaches.
- Third parties appeared in 68% of retail breaches, while vulnerabilities provided initial access in 42%. External actors accounted for 99% of retail breaches, and financial motives appeared in 85%.
Cloud Data Breach Statistics
- Third-party software exploitation accounted for 44.5% of observed cloud initial access in H2 2025, up sharply from only 2.9% in H1 2025. The change made software-based entry the leading vector in the dataset.
- Weak or missing credentials accounted for 27.2% of cloud initial access in H2 2025, down from 47.1% during the first half of the year.
- Remote code execution grew from 2.9% of observed cloud entry methods in H1 2025 to 13.6% in H2, an increase of nearly fivefold.
- Cloud misconfigurations represented 21% of observed initial access in H2 2025, compared with 29.4% during the first half of the year.
- Exposed sensitive interfaces and APIs accounted for 4.9% of cloud initial access in H2 2025, less than half the 11.8% recorded in H1.
- Only 23% of third-party organizations fully remediated missing or improperly secured multifactor authentication on cloud accounts in the 2026 breach dataset.
- Half of detected third-party cloud MFA weaknesses were resolved within about one month, while remediation for weak passwords and permission misconfigurations took almost eight months to reach the same 50% resolution point.
- Third-party involvement appeared in 48% of breaches overall in the 2026 global dataset, following a 60% year-over-year increase. As cloud environments depend heavily on connected services, this trend expands the number of external systems that can create exposure.
Data Breach Cost Statistics
- The worldwide average cost of a data breach reached a record $4.99 million in 2026, an increase of 12% from the previous year. Higher detection, escalation, and lost-business costs helped drive the increase.
- Extensive deployment of security AI and automation reduced average breach costs by $1.93 million compared with organizations that did not use these technologies.
- AI model inversion attacks generated an average breach cost of $6 million globally, reflecting the financial risk attached to attacks targeting sensitive AI models and training data.
- AI-driven attacks increased 56% year over year in 2026, led by deepfake impersonation and AI-assisted malware, creating another source of investigation and recovery expense.
- In India, the average data breach cost increased 15.9% to INR 25.5 crore in 2026, setting a national record.
- Indian financial services organizations recorded average breach costs of approximately INR 40.9 crore, compared with INR 35.7 crore for technology organizations and INR 34.5 crore for communications companies.
- Indian organizations with no security AI or automation averaged INR 31.6 crore per breach, almost 50% more than the INR 21.3 crore average among organizations with extensive deployment.
- U.K. organizations recorded an average breach cost of about £3.13 million in 2026, down from £3.29 million in 2025, while financial services organizations averaged £5.46 million.
- The U.K. organizational survey also found that the most disruptive breach caused loss of revenue or share value for 5% of affected businesses in 2025-26, compared with 2% in the previous survey year.
Average Data Breach Cost by Country
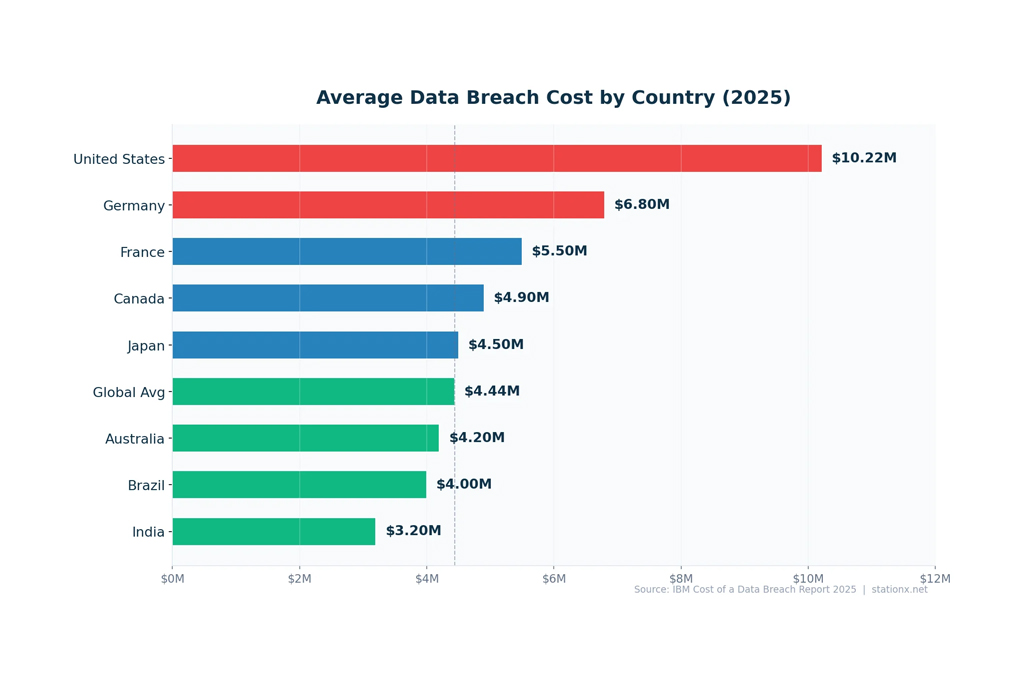
- The United States recorded the highest average data breach cost at $10.22 million, more than twice the global average of $4.44 million.
- Germany ranked second with an average breach cost of $6.80 million, followed by France at $5.50 million.
- Canada reported an average data breach cost of $4.90 million, approximately $460,000 above the global average.
- Japan stood slightly above the global benchmark at $4.50 million, compared with the worldwide average of $4.44 million.
- Australia and Brazil recorded below-average breach costs of $4.20 million and $4.00 million, respectively.
- India had the lowest average among the countries shown at $3.20 million, around 28% below the global average.
- Overall, the data highlights a substantial geographic gap, with average breach costs ranging from $3.20 million in India to $10.22 million in the United States.
Data Breach Detection and Response Statistics
- Organizations took an average of approximately 247 days to identify and contain a breach in the 2026 cost dataset, reversing several years of improvement in breach lifecycle times.
- The average lifecycle increased about 2.5% from 2025, marking the first increase in identification and containment time in five years.
- Supply chain compromises and incidents involving removable media took an average of approximately 258 days to identify and resolve, around 11 days longer than the overall breach average.
- In India, organizations with no security AI or automation required an average of 236 days to identify a breach and another 75 days to contain it, producing a combined lifecycle of 311 days.
- Indian organizations with extensive AI and automation identified breaches in about 175 days, 61 days faster than organizations using no automation.
- Only 26% of critical known exploited vulnerabilities received full remediation during 2025, down from 38% during the previous year.
- Median remediation time for critical known exploited vulnerabilities increased from 32 days to 43 days, while the median organization also faced 50% more critical vulnerabilities requiring patches.
- In the U.K., around 29% of businesses that identified a breach or attack experienced one at least weekly, while another 22% experienced incidents roughly once a month. The figures show why continuous monitoring increasingly matters alongside post-incident response.
- European organizations subject to GDPR generally face a 72-hour deadline for notifying regulators after becoming aware of a qualifying personal data breach, putting additional pressure on investigation and reporting teams to establish scope quickly.
Frequently Asked Questions (FAQs)
Ransomware appears in 48% of confirmed breaches in the latest 2026 global dataset, up from 44% in the previous year.
Software vulnerability exploitation accounts for 31% of breaches, making it the leading initial access method in the 2026 dataset.
Third-party involvement reaches 48% of breaches, representing a 60% year-over-year increase.
More than 471 million victim notices were issued during the first six months of 2026, compared with about 297.5 million during all of 2025.
The average cost of a U.S. data breach has reached approximately $10.22 million, making the U.S. one of the most expensive markets for breach recovery.
Conclusion
Data breach statistics show a threat environment increasingly shaped by vulnerability exploitation, ransomware, third-party exposure, cloud weaknesses and AI-enabled attacks. The worldwide average breach cost has reached $4.99 million, vulnerability exploitation now initiates 31% of global breaches, and ransomware appears in 48% of confirmed breaches. Third-party involvement has also reached 48%, while the human element remains present in 62% of breaches, showing that both technical weaknesses and employee-related risks continue to influence breach outcomes.
The data also highlights a broader shift in how organizations need to approach security. Attackers increasingly target public-facing applications, suppliers, cloud platforms, and legitimate accounts rather than relying on a single entry method. Meanwhile, organizations that use security AI and automation extensively can reduce breach costs and improve detection speed. For businesses, the strongest priorities remain timely patching, multifactor authentication, employee security awareness, supplier oversight, cloud configuration management and well-tested incident response plans. As breach methods continue to evolve, organizations that identify weaknesses early and respond quickly will be better positioned to limit operational disruption, financial losses and customer exposure.
