



The dark web remains a small but influential part of the internet, supporting legitimate privacy needs while also hosting criminal marketplaces, stolen-data exchanges and cybercrime services. Journalists, activists and whistleblowers may rely on anonymous networks in restrictive environments, while criminals use the same infrastructure to trade drugs, credentials, malware and illicit financial services. Millions of daily Tor connections, multibillion-dollar cryptocurrency flows and repeated international takedowns continue to show how closely privacy technology, cybercrime and digital enforcement now intersect. The statistics in this article examine the dark web’s size, users, marketplaces, financial activity and law-enforcement response.
Editor’s Choice
- Around 3.2 million people per day currently connect directly to Tor, based on the latest country-level total implied by published usage shares.
- The United States accounts for 16.07% of direct Tor connections, with an estimated 508,556 daily users in the latest data.
- Russia represents 42.91% of bridge usage, with about 92,825 users per day connecting through bridges.
- Darknet markets received slightly more than $2 billion in Bitcoin during 2024, down from close to $2.3 billion in 2023.
- A major darknet drug market dismantled in June 2025 had accumulated more than 600,000 users, at least €250 million in transaction volume and over 17,000 listings.
- One stolen-payment-data marketplace taken down in 2025 had trafficked more than 15 million payment-card numbers and identity records and generated over $17 million in revenue.
- A 2025 international crackdown produced 270 arrests, more than two metric tons of seized drugs and over 180 confiscated firearms.
Recent Developments
- Cryptocurrency addresses tied to illicit activity received at least $154 billion during 2025, representing a 162% increase from the prior year. The surge came largely from sanctioned entities and nation-state-linked theft rather than darknet markets alone.
- In 2025, an international darknet investigation arrested 270 vendors, buyers and administrators across the United States, Europe, Asia and South America.
- The United States accounted for 130 of those 270 arrests, or about 48% of the operation’s total. Germany followed with 42 arrests, while the United Kingdom recorded 37.
- Authorities seized more than $200 million in currency and digital assets during that operation, setting a record for the enforcement program involved.
- Investigators also confiscated 144 kilograms of fentanyl or fentanyl-laced narcotics, alongside other drugs, during the 2025 enforcement campaign.
- In June 2025, authorities shut down a darknet drug market that had operated for more than five years, accumulated over 600,000 users and processed at least €250 million in transactions.
- Another enforcement action in June 2025 seized approximately 145 darknet and conventional web domains associated with a marketplace that had more than 117,000 customers.
- A separate investigation disclosed in 2025 identified a dark-web criminal site that had received more than $530,000 in cryptocurrency through over 5,800 addresses since July 2022.
- A 2026 prosecution linked to a former darknet marketplace alleged laundering of more than $2 million between August 2023 and April 2025. Searches in May 2026 located roughly $1.7 million in gold and about $1.2 million believed to be held in financial accounts and cryptocurrency wallets.
What Is the Dark Web?
- Conventional Tor connections normally travel through three relays: an entry or guard relay, a middle relay and an exit relay.
- A connection between a Tor user and a standard onion service generally involves six relays in total, three selected by the client and three selected by the onion service.
- Onion services generally establish three introduction points, each reached through a three-hop Tor circuit, to help conceal the physical location of the server.
- Tor normally keeps a user’s first-hop guard relay for approximately two to three months rather than selecting an entirely new entry node for every connection. This design reduces exposure to certain traffic-correlation attacks.
- Researchers reviewing methods for discovering onion services found that published Tor studies explored only 17.5% of the network on average, illustrating why estimates of total dark-web size remain incomplete.
- Modern v3 onion addresses contain 56 base32-coded characters before the .onion suffix, compared with 16 characters in the retired v2 format.
- Direct Tor usage currently includes approximately 137,594 daily users from India, equal to 4.35% of the latest measured direct-user total.
- Current bridge statistics estimate about 26,456 daily users from Iran, representing 12.23% of bridge connections. Bridge use matters because these unlisted relays help users connect where standard Tor infrastructure faces blocking.
Dark Web Intelligence Market Growth Statistics
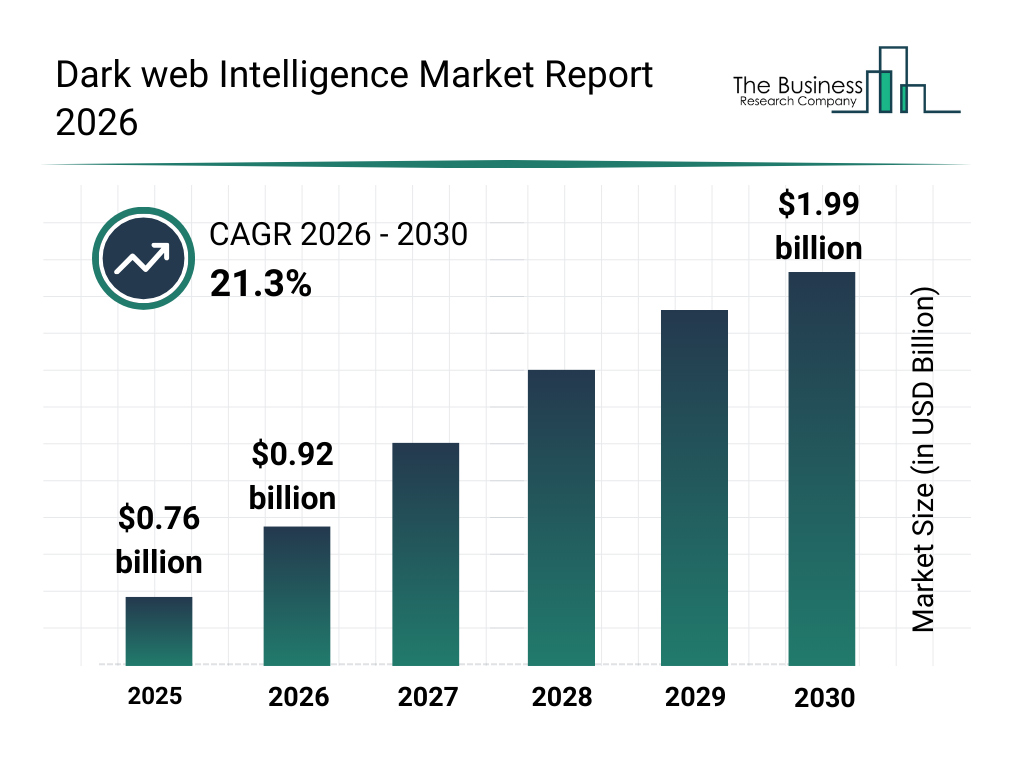
- The global dark web intelligence market is projected to grow from $0.92 billion in 2026 to $1.99 billion by 2030, more than doubling in size within four years.
- The market is expected to record a strong 21.3% CAGR between 2026 and 2030, highlighting rapidly rising demand for dark web monitoring and intelligence solutions.
- In 2025, the dark web intelligence market was valued at approximately $0.76 billion, increasing to $0.92 billion in 2026.
- By 2027, the market is estimated to reach around $1.12 billion, crossing the $1 billion milestone as adoption continues to expand.
- Market size is projected to climb further to approximately $1.37 billion in 2028 and $1.68 billion in 2029, maintaining strong year-over-year growth.
- By 2030, the market is forecast to reach $1.99 billion, representing an increase of roughly 162% compared with its $0.76 billion size in 2025.
Dark Web vs. Deep Web vs. Surface Web
- The standard Tor circuit for reaching the conventional internet uses three hops, while onion-service connections generally use six. This architectural difference helps distinguish Tor-based hidden services from ordinary surface-web browsing.
- Researchers found that studies trying to discover Tor onion addresses sampled only 17.5% of the network on average, making precise claims about the dark web’s share of the total internet unreliable.
- Current direct Tor traffic reaches approximately 3.2 million users per day, but this figure covers Tor network users rather than only people visiting dark-web sites. Tor also routes users to regular surface-web destinations.
- Roughly 216,000 additional daily connections currently use Tor bridges. Bridge traffic likewise cannot be equated directly with dark-web visitation because users may browse ordinary internet services through Tor.
- Onion-service traffic stays inside Tor and therefore uses no public exit relay, unlike standard Tor browsing of surface-web domains.
- Modern onion services use addresses with 56 encoded characters, making them fundamentally different from conventional domain names that resolve through ordinary DNS infrastructure.
- Onion services typically publish descriptors to multiple directories. The measurement methodology assumes an onion service can publish to 12 directories during a 24-hour period, creating deliberate redundancy rather than a conventional searchable DNS listing.
- One 2025 darknet marketplace illustrates the scale possible inside this comparatively difficult-to-measure environment: it reached 600,000-plus registered users and more than 17,000 listings before authorities dismantled it.
How Big Is the Dark Web?
- Current direct-connection statistics imply roughly 3.16 million daily Tor clients, based on the United States’ 508,556 users representing 16.07% of measured direct usage.
- Current bridge statistics imply approximately 216,000 daily bridge clients, based on Russia’s 92,825 users representing 42.91% of bridge traffic.
- Taken together, those measurements indicate more than 3.3 million estimated daily Tor connections across direct relays and bridges, although they should not be interpreted as a count of unique individuals or dark-web-only visitors.
- A major 2025 market had more than 600,000 registered users, showing that individual darknet platforms can build audiences equivalent to sizable mainstream online communities.
- The same market listed more than 17,000 products and services before its shutdown. Its lifetime transaction volume reached at least €250 million.
- Another marketplace had over 150,000 users and 1,100 vendor accounts at its peak.
- That marketplace processed more than 400,000 orders between 2021 and 2024, including more than 55,000 orders categorized as stimulants.
- A stolen-card marketplace operating from 2022 until its 2025 seizure attracted over 117,000 customers, distributed more than 15 million compromised payment-card and identity records, and generated over $17 million in revenue.
- Darknet markets received just over $2 billion worth of Bitcoin in 2024, compared with nearly $2.3 billion in 2023, providing one measurable indicator of the commercial dark-web economy even though it excludes transactions made with other assets or off-chain methods.
Dark Web Access and Usage Trends
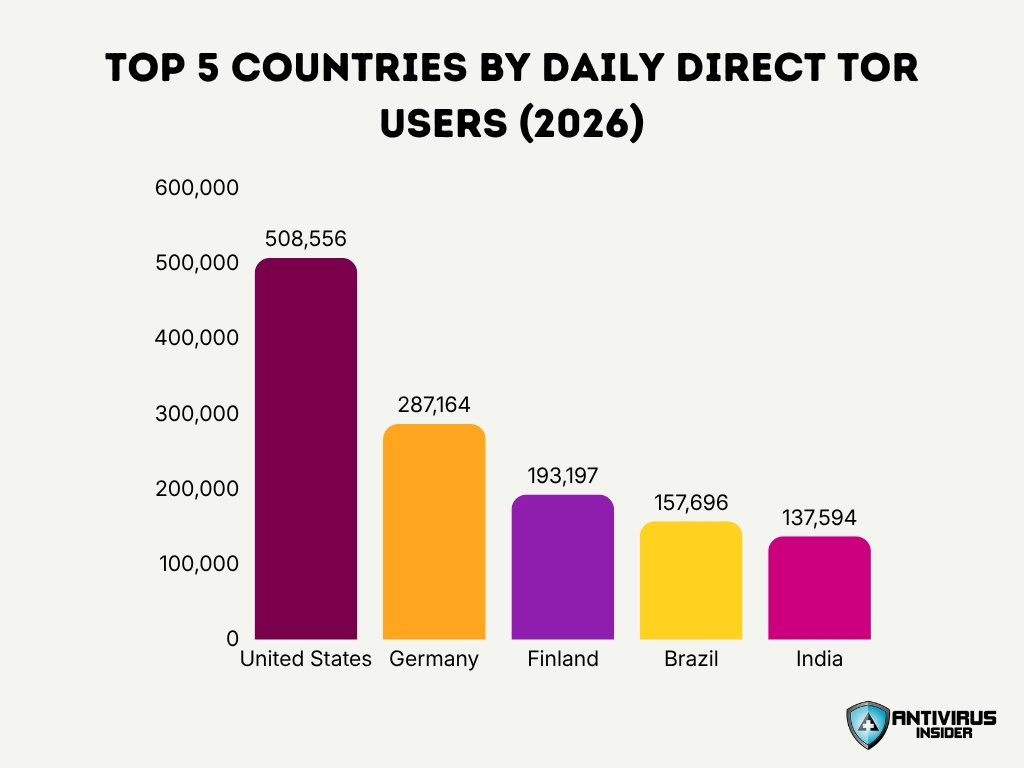
- The latest figures place the United States at 508,556 estimated direct Tor users per day, accounting for 16.07% of measured direct connections.
- Germany ranks second with approximately 287,164 daily direct users, representing 9.07% of the latest total.
- Finland accounts for around 193,197 daily direct users, equal to 6.10% of current measured usage.
- Brazil contributes an estimated 157,696 daily direct users, or 4.98% of direct connections, while India contributes 137,594, or 4.35%.
- Among bridge users, Russia currently accounts for approximately 92,825 daily connections, giving it a 42.91% share.
- Iran contributes about 26,456 daily bridge users, or 12.23% of bridge traffic. The measurement timeline also records continuing connectivity disruption in Iran during 2026.
- The United States contributes approximately 26,166 daily bridge users, or 12.09% of the current bridge total, in addition to its much larger direct-user population.
- During January-February 2026, U.S. bridge usage averaged 40,879 users per day, representing 18.20% of measured bridge use during that period. Iran averaged 30,725 and Russia 85,084.
- In the comparable broad 2024 measurement, Russia averaged 53,378 daily bridge users, compared with 21,094 in Iran and 12,748 in the United States. The 2026 figures therefore show how bridge demand can shift sharply with censorship, blocking and connectivity conditions.
- Tor does not count distinct people directly. Its user figures are derived from directory requests and represent estimated average concurrent users over a day, so one person using multiple devices or sessions cannot be cleanly separated from other clients.
Tor Network Statistics
- Current 2026 network measurements indicate about 3.16 million mean daily direct users. This estimate comes from the U.S. total of 508,556 users, which represents 16.07% of worldwide direct connections.
- Current bridge measurements imply roughly 216,000 mean daily bridge users worldwide. Russia alone accounts for 92,825 users, representing 42.91% of the bridge total.
- By comparison, 2024 averaged roughly 3.09 million direct users per day, calculated from the U.S. average of 440,994 users and its 14.27% share. The overall scale of direct usage has therefore remained in the multimillion-user range.
- Bridge usage has expanded more noticeably. The 2024 data imply about 127,700 daily bridge users, versus roughly 216,000 in the latest 2026 measurement, an increase of nearly 70% based on these period averages.
- Between May 8 and July 31, 2026, Russia averaged 94,652 bridge users per day, equivalent to 44.13% of measured bridge traffic during that period.
- Iran’s network conditions illustrate why bridge statistics can change quickly. An internet shutdown beginning Feb. 28, 2026, appears on the network’s event timeline alongside changes in Iranian bridge connectivity.
- Direct-user statistics do not represent distinct individuals. The measurement system estimates an average number of concurrent clients over a day from directory requests, meaning it cannot determine whether the same person remained connected all day or several users connected sequentially.
- The infrastructure tracks several relay characteristics, including Running, Exit, Fast, Guard, Stable, and HSDir flags. It also separately measures relay and bridge counts, IPv4 and IPv6 support, advertised bandwidth, and consumed bandwidth.
- Bridge traffic can use multiple pluggable transports, including obfs4, Conjure, WebTunnel and Snowflake, allowing users to make Tor traffic harder for network censors to identify and block.
Dark Web Users and Visitor Statistics
- The latest 2026 figures imply more than 3.3 million combined daily direct and bridge connections when the estimated 3.16 million direct users and roughly 216,000 bridge users are considered together. These figures should not be treated as unique people.
- The United States currently produces more than half a million direct Tor connections per day, making it the largest individual country in the latest direct-user table.
- Germany generates about 287,164 daily direct connections, equal to 9.07% of the worldwide estimate.
- Finland contributes approximately 193,197 daily users, or 6.10% of measured direct connections, a substantial share relative to the country’s population.
- Brazil records around 157,696 daily direct users, giving it a 4.98% share of current traffic.
- India contributes an estimated 137,594 direct users per day, or 4.35% of the latest global direct-user total.
- France and the Netherlands currently account for about 127,687 and 105,085 direct users per day, respectively. Their combined daily total exceeds 232,000 connections.
- The United Kingdom adds approximately 103,712 direct users per day, representing 3.28% of measured global direct traffic.
- Research covering 176,683 onion domains and more than 110 million anonymous search sessions from 2018 through 2023 demonstrates how large individual dark-web research datasets can become, even though they capture only part of the overall ecosystem.
Dark Web Categories by Share
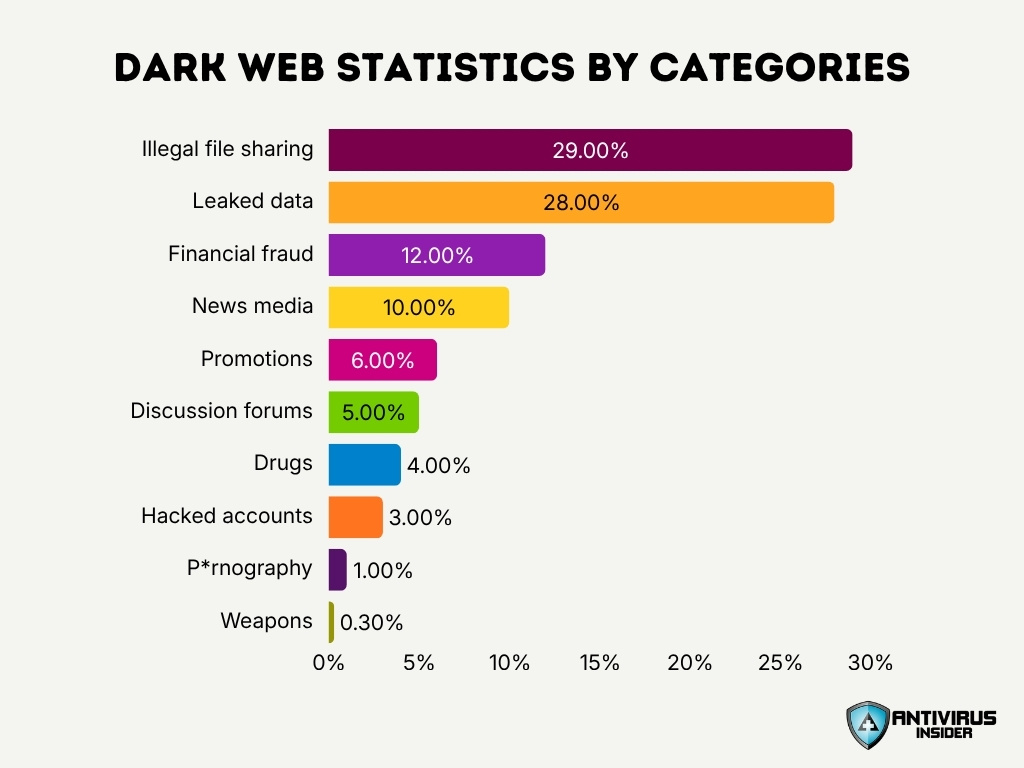
- Illegal file sharing is the largest category, accounting for 29% of dark web activity, narrowly ahead of leaked data.
- Leaked data represents 28%, making it the second-largest category and highlighting the prevalence of exposed or stolen information.
- Together, illegal file sharing and leaked data account for 57% of the categories shown, dominating the overall distribution.
- Financial fraud makes up 12%, while news media accounts for 10%, placing both well behind the two leading categories.
- Promotions and discussion forums represent 6% and 5%, respectively, indicating a smaller but notable presence on the dark web.
- Drugs account for 4%, while hacked accounts represent 3% of the categories included in the dataset.
- P*rnography accounts for just 1%, making it one of the least represented categories in the data.
- Weapons have the smallest share at only 0.3%, substantially below every other category shown.
Dark Web Users by Country and Demographics
- The United States accounts for 16.07% of current direct Tor traffic, ahead of Germany at 9.07%, Finland at 6.10%, Brazil at 4.98%, and India at 4.35%.
- Ukraine represents around 2.32% of direct usage, with an estimated 73,422 daily connections in the latest country table.
- Indonesia contributes approximately 72,596 daily direct users, equivalent to 2.29% of worldwide direct connections.
- Bridge geography looks very different from direct usage. Russia represents 42.91% of current bridge connections, while Iran accounts for 12.23% and the United States for 12.09%.
- China accounts for about 2,479 daily bridge users, or 1.15% of current bridge traffic, despite the country’s extensive internet controls.
- A 2024 cross-national study examined dark-web use with a primary dataset of 8,806 participants and a longitudinal dataset of 1,530 people, making it one of the larger recent behavioral studies of dark-web users.
- That study found that male gender correlated with a greater likelihood of dark-web use, alongside excessive online behavior, gambling problems, poorer social relationships, and certain personality traits. The relationship varied across countries, so the finding does not imply that most Tor users share one demographic profile.
- The same research identified meaningful cross-country differences in the relationships between dark-web use, institutional trust, psychological distress and sociodemographic characteristics. This supports treating regional context as a major variable rather than assuming one global user profile.
- A separate anonymous-network study analyzed 11,470 voluntary survey responses linked to one particularly harmful category of dark-web content. That scale illustrates how behavioral research can provide demographic and psychological insights without representing the broader population of privacy-network users.
Dark Web Websites and Hidden Services
- Current onion-service monitoring focuses on version 3 .onion addresses, with unique addresses estimated from aggregated statistics reported by relays acting as hidden-service directories.
- The measurement system only extrapolates unique v3 onion-address counts when at least 1% of eligible relays report the relevant statistics, which helps explain why dark-web site counts remain estimates rather than a conventional domain census.
- A large-scale academic investigation analyzed 176,683 onion domains collected between 2018 and 2023, demonstrating the enormous churn and discoverable volume within the onion ecosystem.
- That investigation examined 26 heavily used Tor search engines and found that 21 exposed results connected with the specific harmful content category being studied. This illustrates how search and indexing services can make otherwise hidden content more discoverable.
- The researchers analyzed more than 110.1 million search sessions, providing one of the largest published datasets involving search behavior on onion services.
- Dark-web discovery remains incomplete even in large research projects. A separate review found that onion-service discovery studies explored only about 17.5% of the network on average, highlighting the limitations of claims that purport to count the entire dark web.
- Commercial hidden services can reach significant scale. Archetyp Market alone carried more than 17,000 listings before authorities dismantled it in June 2025.
- Nemesis Market had more than 1,100 registered vendor accounts at its peak, showing that a single hidden marketplace can host a sizable distributed seller population.
- BidenCash operated through both darknet and conventional internet infrastructure. Authorities seized approximately 145 domains associated with the operation in June 2025, illustrating how modern criminal services can span both hidden and surface-web infrastructure.
Dark Web Marketplace Revenue and Listings
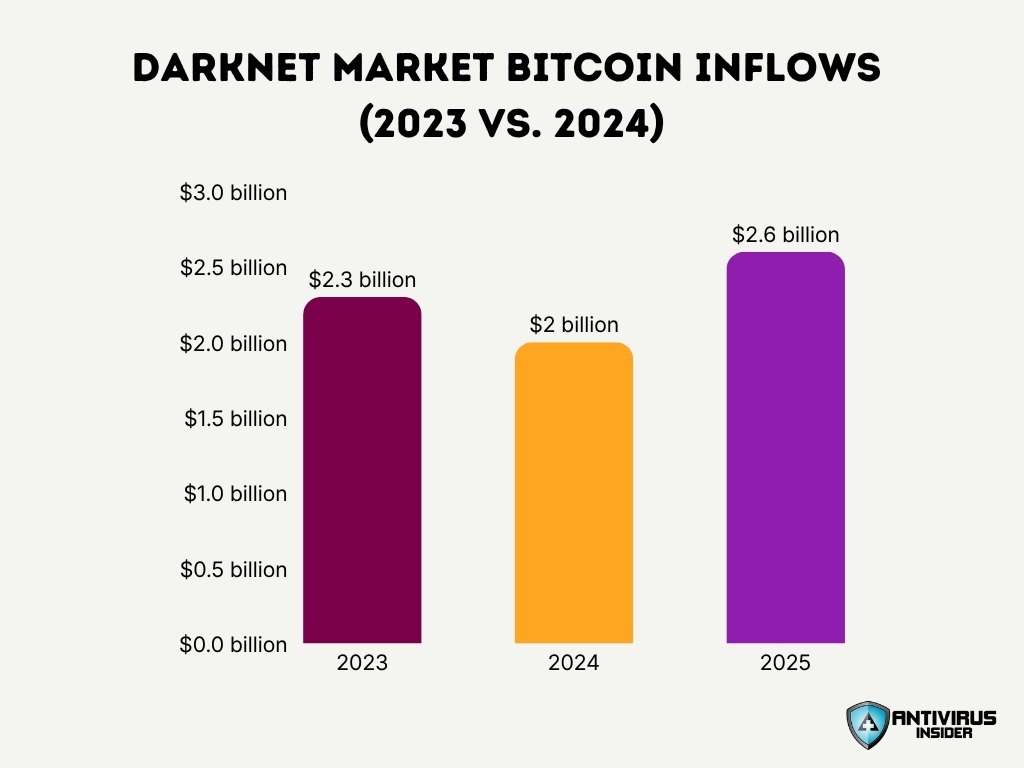
- Darknet markets received slightly more than $2 billion in Bitcoin during 2024, compared with close to $2.3 billion during 2023. The totals exclude substantial activity conducted through privacy-focused cryptocurrencies.
- Fraud shops received around $225 million in Bitcoin during 2024, and their Bitcoin inflows fell approximately 50% year over year.
- Wholesale drug purchases accounted for roughly 71% to 81% of darknet-market crypto inflows during 2024, showing that high-value bulk transactions represented most measured market volume.
- Archetyp processed at least €250 million in lifetime transactions before its 2025 shutdown, while maintaining more than 17,000 listings across its marketplace.
- BidenCash generated more than $17 million in marketplace revenue over roughly three years of operation. Administrators earned revenue by charging fees on transactions.
- During the same period, BidenCash facilitated the trafficking of more than 15 million payment-card numbers and associated identity records.
- Incognito Market sold more than one metric ton of narcotics before it closed in March 2024, alongside more than $105 million in illegal drug sales.
- In 2024, the five countries with the highest number of Abacus listings were the United States, Canada, Germany, Australia and the United Kingdom, showing the platform’s strong Western-market footprint.
- Investigators identified 16 vendors that either sold or sourced drug materials through Abacus while also purchasing production supplies from a China-based equipment vendor linked to pill-production machinery.
Dark Web Marketplace Statistics
- Archetyp Market operated for more than five years before its June 2025 takedown and had accumulated more than 600,000 registered users worldwide.
- Nemesis Market reached more than 150,000 users at its peak and supported over 1,100 registered vendors across multiple countries.
- Between 2021 and 2024, Nemesis processed more than 400,000 orders, indicating an average exceeding 100,000 transactions per operating year if spread evenly across that period.
- More than 55,000 Nemesis orders involved stimulants such as methamphetamine, cocaine and crack cocaine. Another 17,000 involved opioids, including fentanyl, heroin and oxycodone.
- Incognito Market operated from October 2020 until March 2024 and ultimately sold more than $105 million in illegal narcotics worldwide, according to sentencing information released in February 2026.
- Abacus Market became the highest-earning Western darknet marketplace accepting Bitcoin in 2024, receiving $43.3 million on-chain during the year.
- Abacus’ Bitcoin-denominated revenue grew 183.2% year over year in 2024, partly as users migrated from markets that had closed and other markets shifted toward privacy-focused cryptocurrencies.
- After Archetyp disappeared in June 2025, Abacus recorded its largest monthly sales volume at approximately $6.3 million, before itself going offline in early July.
- Another major criminal marketplace grew to more than 117,000 customer accounts between March 2022 and its 2025 seizure, showing that fraud-oriented dark-web markets can develop audiences comparable to large drug markets.
Dark Web Marketplace Closures, Seizures, and Takedowns
- In May 2025, a coordinated international crackdown produced 270 arrests across 10 countries and four continents, targeting dark-web vendors, buyers and administrators.
- That operation seized more than $200 million in cash and digital assets, more than two metric tons of drugs, 144 kilograms of fentanyl or fentanyl-laced substances and over 180 firearms.
- Investigators identified suspects partly through intelligence obtained from earlier takedowns of four major marketplaces: Nemesis, Tor2Door, Bohemia and Kingdom.
- In June 2025, approximately 300 officers participated in coordinated actions across Germany, the Netherlands, Romania, Spain and Sweden against Archetyp’s administrators, moderators, vendors and infrastructure.
- Authorities seized roughly 145 darknet and conventional domains tied to BidenCash on June 4, 2025, along with associated cryptocurrency funds.
- January 2025 saw another international operation dismantle two large underground cybercrime forums with more than 10 million combined users. Investigators estimated that suspects generated about €1 million in criminal profits.
- That January operation resulted in two arrests and seven property searches, showing that smaller numbers of direct enforcement actions can still disrupt platforms serving millions of registered accounts.
- In February 2026, the operator of Incognito Market received a 30-year federal prison sentence after pleading guilty to narcotics distribution and money-laundering offenses connected to the marketplace.
- In May 2026, a seller connected to Nemesis received a sentence of more than 26 years in federal prison, demonstrating how prosecutions connected with dismantled markets can continue years after the underlying marketplace closes.
- Abacus followed a different path. After reaching a record $6.3 million in monthly sales in June 2025, it went offline in July 2025 amid withdrawal problems and indications of a likely exit scam rather than a publicly confirmed seizure.
Dark Web Cryptocurrency and Money Laundering Statistics
- Illicit cryptocurrency addresses received at least $154 billion in 2025, a 162% year-over-year increase. Even so, identified illicit transactions still represented less than 1% of attributed cryptocurrency volume.
- Stablecoins represented about 84% of identified illicit cryptocurrency transaction volume in 2025, showing how criminal activity has moved beyond Bitcoin as stablecoin adoption has expanded across the broader crypto economy.
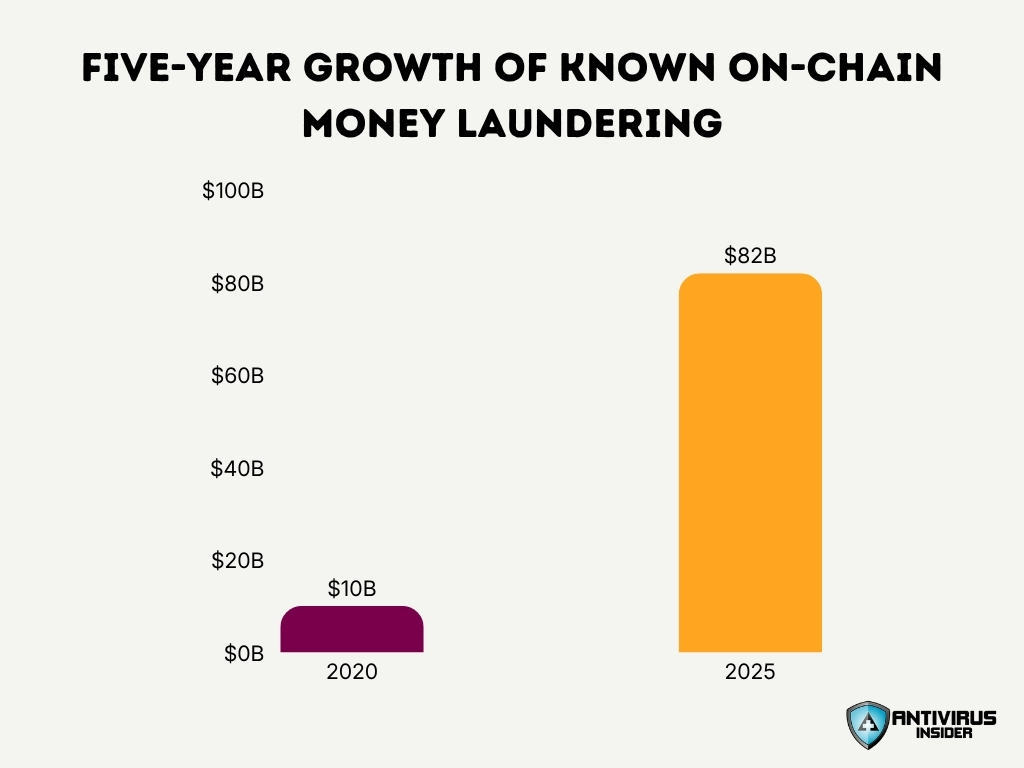
- Known on-chain money laundering activity exceeded $82 billion in 2025, up from roughly $10 billion in 2020. That represents an increase of more than eightfold in five years.
- Chinese-language money laundering networks processed approximately $16.1 billion during 2025, equivalent to about $44 million per day across more than 1,799 active wallets.
- Those laundering networks accounted for roughly 20% of known illicit crypto laundering activity in 2025 and have expanded 7,325 times faster than illicit inflows to centralized exchanges since 2020.
- Wallets directly associated with illicit entities held nearly $15 billion in cryptocurrency in 2025, while downstream wallets with substantial exposure to illicit funds held more than $60 billion.
- Darknet marketplace administrators and vendors collectively controlled more than $40 billion in on-chain value in 2025, highlighting the large accumulated holdings linked with historical and current illicit marketplace activity.
- Bitcoin represented about 75% of balances held by identified illicit entities in 2025, despite stablecoins accounting for a much larger share of current illicit transaction volume.
- A 2026 investigation into funds linked with a former darknet marketplace alleged laundering of more than $2 million between August 2023 and April 2025. Searches later located about $1.7 million in gold, more than $23,000 in cash, and accounts or wallets believed to contain another $1.2 million.
Dark Web Drug Trade Statistics
- Cryptocurrency inflows to darknet markets and drug vendors reached nearly $2.6 billion in 2025, increasing slightly from 2024 despite major marketplace disruptions and international enforcement campaigns.
- In comparison, darknet markets received just over $2 billion in Bitcoin during 2024, while fraud shops received another $225 million. The 2025 figures show that illicit drug commerce remained resilient after earlier marketplace closures.
- One European dark-web drug marketplace dismantled in June 2025 had generated at least €250 million in transactions during more than five years of operation and attracted over 600,000 registered users.
- That marketplace contained more than 17,000 drug listings and was among the relatively small number of major darknet markets that openly permitted fentanyl and other highly potent synthetic opioids.
- A separate darknet drug marketplace sold more than $105 million in narcotics between October 2020 and March 2024 before its operator received a 30-year sentence in February 2026.
- That market facilitated sales exceeding 1,000 kilograms of cocaine and 1,000 kilograms of methamphetamine, along with hundreds of kilograms of other drugs and more than 4 kilograms of purported oxycodone.
- The marketplace operator personally collected more than $6 million in profits, with vendors paying a 5% commission on each narcotics transaction processed through the site’s internal cryptocurrency system.
- A 2025 international darknet crackdown seized more than two metric tons of drugs, including 144 kilograms of fentanyl or substances containing fentanyl. Investigators also confiscated more than 180 firearms.
- A U.S. darknet narcotics vendor sentenced in June 2026 was found with approximately 672 grams of methamphetamine when arrested after conducting multiple undercover cryptocurrency transactions involving methamphetamine and fentanyl pills.
- Four defendants sentenced in 2026 received a combined more than 57 years in prison for a counterfeit-pill operation that distributed products containing fentanyl, methamphetamine, bromazolam and the synthetic opioid N-pyrrolidino etonitazene through darknet markets.
Dark Web Stolen Data and Credential Statistics
- The five most active infostealer families generated more than 8 million dark-web advertisements in 2024, with individual listings potentially containing hundreds of stolen credentials.
- The volume of infostealer credentials offered for sale on dark-web markets grew about 12% year over year, reflecting continued demand for compromised accounts.
- Abuse of user identities served as the initial access method in approximately 30% of investigated cyber incidents during 2024, demonstrating the operational value of stolen account information.
- Stolen credentials appeared in 31% of analyzed breaches in the latest large-scale breach dataset, illustrating how credential markets feed directly into corporate intrusions.
- Among hacking-related breaches, stolen or brute-forced credentials accounted for approximately 88% of cases in 2024.
- Investigators identified at least 1.7 million instances in which one major infostealer captured information such as browser data, banking logins, email credentials and cryptocurrency seed phrases.
- In just two months between March 16 and May 16, 2025, investigators identified more than 394,000 infected Windows computers associated with the same infostealer operation.
- A cybercrime forum dismantled in January 2025 had more than 4 million users and 28 million posts promoting hacking products and stolen information. Investigators linked it with at least 17 million U.S. victims.
- Another dismantled forum had more than 5 million registered users and 43 million posts, while generating about $1 million in revenue each year. One advertised database allegedly included names and Social Security numbers for 500,000 Americans.
- Since January 2025, U.S. authorities have received more than 5,100 bank-account takeover complaints reporting over $262 million in losses. A database seized in December 2025 contained stolen banking credentials belonging to thousands of victims.
Dark Web Malware, Ransomware, and Cybercrime-as-a-Service Statistics
- On-chain ransomware payments reached approximately $820 million in 2025, down about 8% from an updated $892 million estimate for 2024.
- Despite lower payments, the number of publicly claimed ransomware attacks increased about 50% in 2025, showing that attack volume and criminal revenue did not move in the same direction.
- The median ransomware payment climbed 368% year over year to nearly $60,000 in 2025, even as aggregate payments declined.
- Initial-access broker cryptocurrency inflows typically precede increases in ransomware payments and victim disclosures by roughly 30 days, indicating that criminal access markets can serve as an early warning signal for ransomware activity.
- More than 3,600 ransomware complaints were reported to U.S. authorities in 2025, with disclosed direct losses exceeding $32 million. Investigators also identified 63 previously unseen ransomware variants during the year.
- The most frequently reported ransomware variants accounted for 56.8% of reported 2025 ransomware incidents and almost half of the ransomware losses reported through the complaint system.
- One major infostealer disruption in 2025 resulted in more than 2,300 malicious domains being seized or blocked, cutting infrastructure used to steal credentials and feed access brokers and other cybercriminal groups.
- A late-2025 international malware operation disrupted more than 1,025 servers and seized 20 domains. The targeted infrastructure contained millions of stolen credentials harvested from hundreds of thousands of infected systems.
- A March 2026 operation shut down more than 373,000 dark-web sites linked with a network offering fraudulent platforms and cybercrime-as-a-service capabilities. Authorities also seized 105 servers and identified 440 customers.
- Another 2025 infrastructure operation seized 39 domains used to sell phishing kits, scam pages and email-extraction tools. The services had helped criminal groups cause more than $3 million in identified U.S. victim losses.
Dark Web Law Enforcement, Arrests, and Prosecutions
- An international darknet enforcement campaign announced in May 2025 resulted in 270 arrests across 10 countries and four continents, targeting vendors, buyers, and marketplace administrators.
- The same operation seized more than $200 million in currency and digital assets, making it the largest seizure total recorded by that enforcement program at the time.
- Intelligence from the earlier shutdowns of four darknet marketplaces, Nemesis, Tor2Door, Bohemia and Kingdom, helped investigators identify suspects in the 2025 operation.
- Around 300 officers participated in the June 2025 operation that dismantled Archetyp Market, with actions conducted across Germany, the Netherlands, Romania, Spain and Sweden.
- In January 2025, authorities dismantled two major cybercrime marketplaces that together had more than 9 million registered accounts and more than 71 million posts advertising cybercrime tools or stolen information.
- In May 2026, a darknet marketplace administrator received a 200-month federal prison sentence for helping operate a market that facilitated thousands of transactions involving drugs, stolen financial data, fraudulent identity documents, counterfeit currency, and malware.
- In February 2026, the operator of a major narcotics market received 30 years in prison plus five years of supervised release and more than $105 million in forfeiture.
- In June 2026, a darknet drug vendor received more than 26 years in federal prison after undercover agents documented methamphetamine and fentanyl transactions made through a darknet marketplace.
- A March 2026 international operation involving 23 countries identified 440 customers of a fraudulent dark-web platform and shut down more than 373,000 associated websites. Investigations remained active against more than 100 individuals when the results were announced.
- A May 2026 money-laundering case connected with a marketplace that closed in 2019 produced 12 U.S. criminal counts against an alleged administrator: six counts of international concealment money laundering and six counts of concealment money laundering. Each charge carries a potential maximum sentence of 20 years.
Frequently Asked Questions (FAQs)
Darknet markets and drug vendors received nearly $2.6 billion in cryptocurrency in 2025, slightly higher than the previous year.
Authorities shut down more than 373,000 dark web websites, seized 105 servers, and identified 440 customers during the March 2026 operation.
The 2025 international operation resulted in 270 arrests across 10 countries, including 130 arrests in the United States.
Authorities seized more than $200 million in currency and digital assets, along with over two metric tons of drugs and more than 180 firearms.
On-chain ransomware payments reached about $820 million in 2025, down approximately 8% year over year even as claimed ransomware attacks increased by 50%.
Conclusion
Dark web statistics show an ecosystem that remains commercially significant, technically resilient, and increasingly exposed to financial tracing and coordinated international investigations. Illicit cryptocurrency addresses received at least $154 billion in 2025, while darknet markets and drug vendors attracted nearly $2.6 billion in cryptocurrency flows. Ransomware payments reached approximately $820 million, even as publicly claimed attacks increased by 50%, highlighting the changing economics of cyber extortion.
At the same time, major enforcement campaigns produced 270 arrests, seized hundreds of millions of dollars in currency and digital assets, and disrupted large-scale criminal infrastructure. One operation alone shut down more than 373,000 dark-web sites, showing how investigators now target not only individual marketplace operators but also hosting systems, laundering networks and service providers. Overall, the data points to three continuing trends: sustained demand for anonymity, a more specialized cybercrime economy and stronger cross-border enforcement. Because anonymous networks are difficult to measure precisely, these figures should be treated as evidence of scale and direction rather than a complete count of all dark-web activity.
