



Cybersecurity vulnerabilities now affect nearly every layer of modern business, from cloud infrastructure and enterprise applications to mobile devices, connected equipment, and third-party software. Financial institutions must protect internet-facing systems that can expose customer and transaction data, while manufacturers increasingly depend on connected production environments where a single unpatched weakness can disrupt operations. Healthcare providers, retailers, and technology companies face similar pressure as attackers combine software flaws with stolen credentials, social engineering, and supply-chain access. The statistics below show how vulnerability disclosure, exploitation, zero-day activity, remediation delays, and emerging AI-related threats are reshaping cyber risk and security priorities worldwide.
Editor’s Choice
- Vulnerability exploitation became the leading initial-access method in the 2026 breach dataset, accounting for 31% of breaches and overtaking credential abuse for the first time in the report’s 19-year history.
- Credential abuse, previously the leading entry method, accounted for 13% of breaches in the 2026 dataset, creating an 18-percentage-point gap between credential abuse and vulnerability exploitation.
- Third-party involvement reached 48% of breaches in the 2026 dataset, up 60% from the previous year and highlighting the vulnerability exposure created by software suppliers, service providers and connected partners.
- Only 26% of critical known-exploited vulnerabilities measured in 2025 were fully remediated, compared with 38% in the prior reporting period.
- The median time required to fully resolve those critical vulnerabilities increased to 43 days, compared with 32 days previously.
- Organizations in the 2026 reporting dataset faced 50% more critical vulnerabilities at the median than they did in the previous dataset.
- Public CVE production reached 48,244 records in 2025, up from 40,077 in 2024, an increase of about 20.4%.
- During the first half of 2026, 35,872 CVE records were published, already equal to roughly 74% of the entire 2025 annual total.
Recent Developments
- During the first half of 2026, researchers identified 495 CVEs with first-time evidence of exploitation, providing a direct measure of vulnerabilities that newly entered the active threat landscape.
- Those 495 exploited flaws represented only a 1.4% exploited-to-published-CVE ratio, down from 1.9% during the first half of 2025.
- Among 1,061 vulnerabilities discovered with AI assistance, only 14 had confirmed real-world exploitation by mid-2026, an exploitation rate of about 1.3%.
- Researchers tracked 1,611 AI-discovered findings against a 90-day disclosure window, but only 27 had received patches by July 21, 2026.
- High- and critical-severity vulnerability disclosures reached 8,539 in Q2 2026, almost exactly double the 4,268 recorded in Q2 2025.
- Of 40 newly exploited vulnerabilities examined in Q2 2026, 25, or 62%, required no authentication or user interaction and could be exploited over a network. The comparable proportion was 53% in Q2 2025.
- In the first half of 2026, 88% of observed exploitation involving vulnerabilities with public proof-of-concept code occurred within 48 hours of that code becoming available.
- Researchers reported in May 2026 that, for the first time, they had identified a threat actor using a zero-day exploit believed to have been developed with AI assistance, marking a notable shift from AI-supported reconnaissance toward AI-supported exploit development.
Global Vulnerability Landscape Statistics
- The 2025 breach study analyzed more than 22,000 security incidents, including 12,195 confirmed data breaches, creating one of the largest annual datasets available for assessing attack methods.
- Vulnerability exploitation as an initial access method increased 34% year over year in that 2025 dataset, with perimeter devices and VPN infrastructure receiving particular attention from attackers.
- Third-party involvement accounted for 30% of breaches in 2025, roughly double the share recorded in the prior year’s analysis.
- Ransomware appeared in 44% of breaches in the 2025 dataset following a 37% year-over-year increase.
- Within the APAC dataset, malware appeared in 83% of breaches, up from 58% one year earlier.
- Ransomware accounted for 51% of APAC breaches in the 2025 analysis, illustrating how vulnerability exploitation and malware-driven intrusion patterns vary by region.
- In EMEA, system intrusion represented 53% of breaches in the 2025 dataset, nearly twice the previous year’s level.
- Internal actors accounted for 29% of EMEA breaches, compared with 5% in North America and 1% in APAC, showing substantial geographic differences in vulnerability and access-related exposure.
Common Vulnerabilities and Exposures (CVE) Statistics
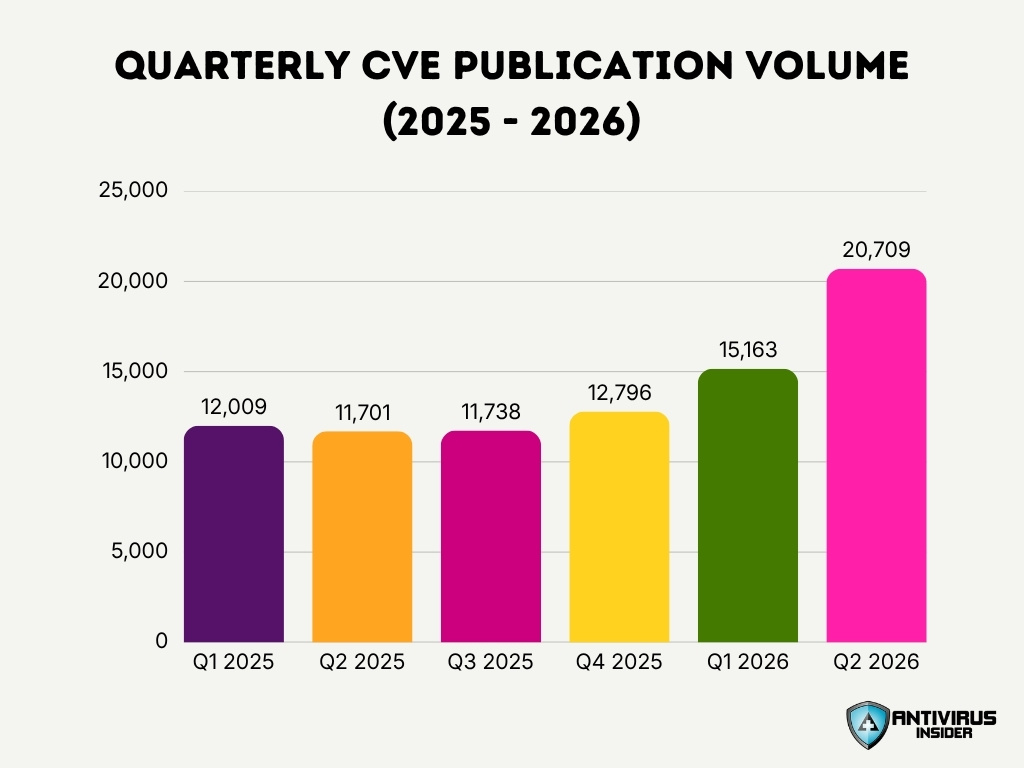
- 15,163 CVE records were published in Q1 2026, compared with 12,009 in Q1 2025, representing an increase of about 26%.
- CVE publication accelerated further in Q2 2026, reaching 20,709 records, up roughly 77% from the 11,701 records published in Q2 2025.
- The 2025 calendar year started with 12,009 published CVEs in Q1, making it the year’s second-highest quarter after Q4.
- Q2 2025 produced 11,701 CVE records, a 3% decline from the first quarter before publication volume started climbing again.
- Q3 2025 added 11,738 published records, a modest increase of about 0.3% from Q2.
- Q4 2025 reached 12,796 CVE records, 9% more than Q3 and the largest quarterly total of the year.
- The number of CVE IDs reserved during 2025 reached 70,729, compared with 52,316 in 2024, an increase of roughly 35%.
- The dataset used to calculate the 2025 list of the most dangerous software weaknesses contained 39,080 CVE records mapped to underlying weakness categories.
Zero-Day Vulnerability Statistics
- Researchers tracked 90 zero-day vulnerabilities exploited in the wild during 2025, compared with 78 in 2024, an increase of about 15%.
- Enterprise software and appliances accounted for 43 zero-days, or 48% of the 2025 total, up from 36 and 46%, respectively, in 2024.
- Security and networking products accounted for 21 enterprise-focused zero-days in 2025, roughly half of all enterprise zero-day vulnerabilities recorded during the year.
- Edge devices accounted for at least 14 zero-day vulnerabilities identified in 2025, although researchers warned that limited endpoint visibility on appliances likely causes undercounting.
- Operating systems accounted for 39 zero-days, or 44% of the 2025 total, compared with 31 in 2024 and 33 in 2023.
- Mobile zero-day exploitation increased to 15 vulnerabilities in 2025, up from nine in 2024 and close to the 17 recorded in 2023.
- Memory-safety problems, including use-after-free and out-of-bounds-write flaws, represented roughly 35% of tracked zero-days in 2025.
- Financially motivated threat groups exploited nine zero-days in 2025, nearly double the five attributed to such actors in 2024 and close to the record of 10 observed in 2023.
Vulnerability Disclosure Trends
- By March 2026, 502 organizations were authorized to participate in the global CVE assignment ecosystem, consisting of 499 regular numbering authorities and three authorities of last resort.
- Since the distributed assignment model expanded from just 23 organizations in 2016, 479 additional organizations had joined by March 2026.
- The public vulnerability catalog crossed the 300,000-record milestone in 2025, reflecting both increased software exposure and broader participation in vulnerability disclosure.
- Regular numbering authorities generated 94% of CVE publications in 2026, while authorities of last resort accounted for only 6%.
- In 2025, regular numbering authorities produced 89% of published CVE records, compared with 85% in 2024 and 79% in 2023, showing the continuing decentralization of vulnerability disclosure.
- A major coordinated vulnerability platform reported 580,000-plus validated vulnerabilities in its 2025 annual dataset, based on activity from approximately 1,950 enterprise programs.
- Across more than 1,300 programs, the number of valid vulnerabilities increased 12% year over year to 78,042, showing that higher disclosure volume extends beyond the CVE ecosystem.
- AI-related vulnerability reports increased 210% in 2025, while reports involving prompt injection jumped 540%, illustrating how disclosure programs are rapidly expanding into AI-specific attack surfaces.
Vulnerability Class Trends and Growth
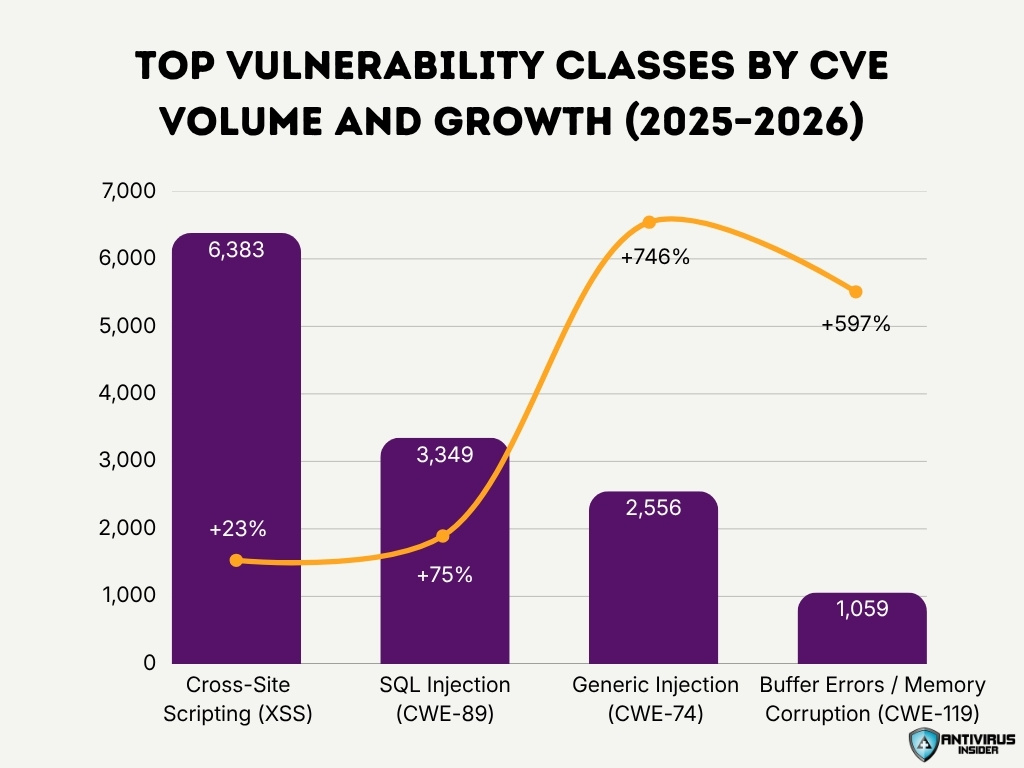
- Cross-Site Scripting (XSS) recorded the highest annual volume at 6,383 CVEs, representing 23% year-over-year growth.
- SQL Injection (CWE-89) accounted for 3,349 CVEs, with a substantial 75% YoY increase.
- Generic Injection (CWE-74) reached 2,556 CVEs and posted the fastest growth among the categories at an exceptional 746% YoY.
- Buffer Errors and Memory Corruption (CWE-119) totaled 1,059 CVEs, while surging by 597% year over year.
- Combined, these four vulnerability classes represented 13,347 CVEs, highlighting the significant volume associated with injection, scripting, and memory-related weaknesses.
- Although XSS led in overall volume, the explosive growth of Generic Injection (+746%) and Buffer Errors (+597%) signals rapidly increasing exposure in these vulnerability classes.
Industry-Specific Vulnerability Statistics
- Manufacturing recorded 2,713 breaches in the 2026 industry dataset, giving researchers a substantial sample for examining attacks against industrial organizations.
- Hacking actions appeared in 71% of manufacturing breaches, while vulnerability exploitation and stolen credentials each contributed to 41% of breaches in that sector.
- Internal corporate data appeared in 80% of manufacturing breaches, while credentials appeared in 26% and personal data in 17%.
- Healthcare recorded 1,492 incidents and 1,438 confirmed breaches in the 2026 dataset. System intrusion, miscellaneous errors, and social engineering together represented 81% of healthcare breaches.
- Vulnerability exploitation accounted for 20% of initial access in healthcare breaches, compared with 14% for phishing and 11% for credential abuse.
- Third parties contributed to 32% of healthcare breaches, while the human element appeared in 54%. Personal information was compromised in 37% of breaches.
- Retail breaches nearly doubled in the 2026 industry analysis, and internal corporate data appeared in 84% of retail breaches.
- Across 2025 ransomware disclosures, healthcare recorded 538 victims, manufacturing 473 and finance 316. Those totals represented year-over-year increases of 39%, 71% and 50%, respectively.
- In a January-August 2026 cross-industry dataset, information technology recorded 30 identified victims, followed by manufacturing with 24 and healthcare with 17, illustrating continued concentration around technology-dependent sectors.
Software and Application Vulnerability Statistics
- In the 2026 open source analysis, 87% of assessed codebases contained at least one open source vulnerability, up one percentage point from the previous dataset.
- The mean number of open source vulnerabilities per codebase jumped from 280 to 581, an increase of 107% between the two reporting periods.
- The median number of vulnerabilities per codebase increased 32%, from 59 to 78, showing that the rise extended beyond a small number of extreme outliers.
- Codebases contained an average of 237 unique vulnerabilities, compared with 154 in the previous reporting period, a 54% increase.
- The most exposed codebase contained 38,998 vulnerability instances, up 12% from the prior maximum of 34,736.
- The 2025 open source assessment found vulnerable open source components in 86% of risk-assessed codebases, while 81% contained at least one high- or critical-risk vulnerability.
- High-risk open source vulnerabilities appeared in 100% of assessed internet and mobile application codebases in the 2025 analysis. Enterprise software and SaaS reached 86%, while financial services and FinTech reached 83%.
- During 2025, the software advisory ecosystem published 4,101 reviewed security advisories, 7,197 malware advisories, and 2,903 CVEs through one major open-source disclosure program.
- Internet-facing security testing conducted throughout 2025 found that more than 20% of discovered vulnerabilities across the application and infrastructure stack carried high or critical severity ratings.
- SQL injection remained the most common critical web application vulnerability in the 2026 assessment, retaining the position it has held since 2022.
Cloud and Infrastructure Vulnerability Statistics
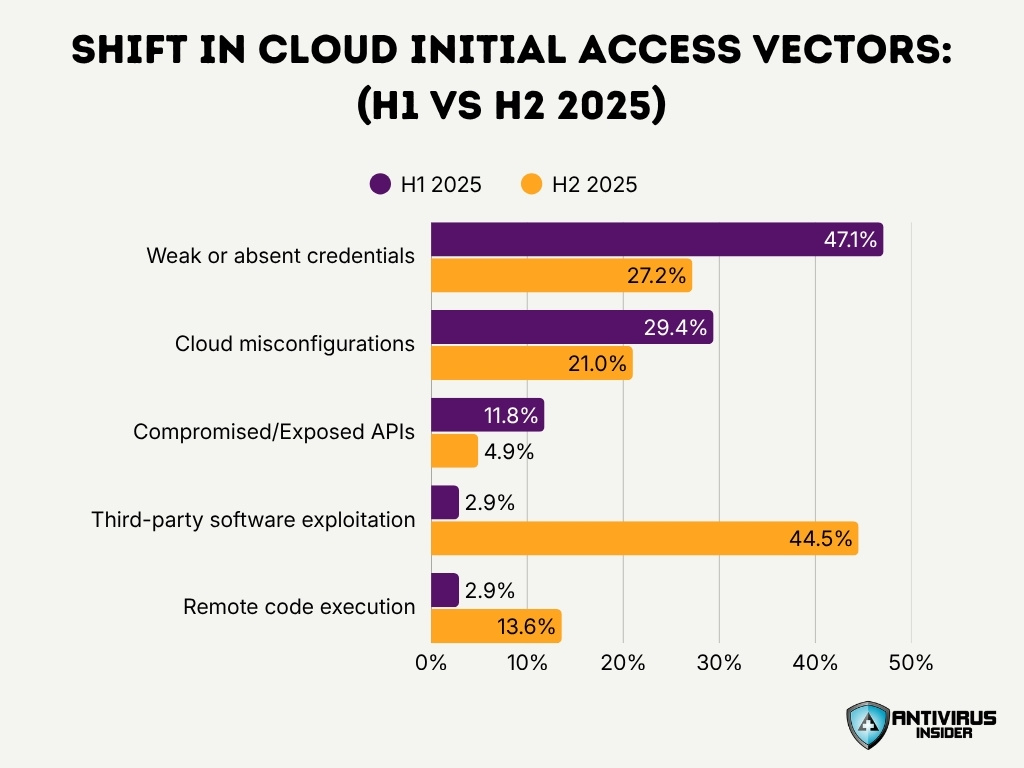
- Weak or absent credentials accounted for 47.1% of observed cloud initial-access incidents in the first half of 2025, making identity weaknesses the dominant entry method during that period.
- Cloud misconfigurations accounted for another 29.4% of initial-access incidents in H1 2025, while compromised or exposed APIs and user interfaces accounted for 11.8%.
- By the second half of 2025, third-party software exploitation had risen to 44.5% of observed initial-access activity, compared with just 2.9% in the first half.
- Over the same period, weak or absent credential-based entry dropped from 47.1% to 27.2%, allowing software vulnerabilities to overtake credentials as the primary cloud entry vector in the observed dataset.
- Remote code execution increased almost fivefold, from 2.9% in H1 to 13.6% in H2 2025, signaling greater attacker use of unpatched application-layer vulnerabilities.
- Misconfiguration-based initial access declined to 21% in H2 2025, from 29.4% in the first half of the year.
- Exposed sensitive interfaces and APIs fell from 11.8% to 4.9% between the first and second halves of 2025, suggesting that stronger automated controls reduced some configuration-driven opportunities.
- In a separate set of investigated cloud-related cases, silent data exfiltration and espionage accounted for 45% of intrusions, often involving long dwell times and persistent access.
- Malicious insiders accounted for 7% of cases in that investigation set, while another 7% resulted from improperly configured application or infrastructure assets.
Vulnerability Exploitation and Attack Statistics
- Vulnerability exploitation became the top breach entry point in the 2026 global dataset, initiating 31% of breaches and surpassing stolen credentials for the first time in the report’s 19-year history.
- Ransomware appeared in 48% of breaches in the 2026 dataset, reinforcing the link between successful initial access and financially motivated follow-on attacks.
- More than 14,000 public exploits were tracked for over 10,000 vulnerabilities carrying 2025 CVE identifiers, representing a 16.5% year-over-year increase in same-year exploit coverage.
- Yet only about 1% of 2025 CVEs had confirmed in-the-wild exploitation by the end of the year, demonstrating the large difference between available exploit code and observed attacks.
- Of the vulnerabilities added to one known-exploitation dataset during 2025, 47.7% carried 2025 CVE identifiers, showing how quickly attackers moved against recently disclosed flaws.
- Among ransomware-linked vulnerabilities identified in 2025, 56.4% were discovered through zero-day exploitation, making ransomware an important driver of exploitation before patches became broadly available.
- Roughly one-third of known 2025 ransomware vulnerabilities still lacked public or commercial exploit code as of January 2026, meaning defenders could not rely on public proof-of-concept availability as a complete exploitation signal.
- In Q2 2026, researchers recorded 40 newly exploited vulnerabilities, an 8% increase from the comparable reporting period.
- Of those 40 exploited vulnerabilities, 25, or 62%, required no authentication or user interaction and were network exploitable, compared with 53% of exploited vulnerabilities in Q2 2025.
Vulnerability Patching and Remediation Statistics
- High- and critical-severity application vulnerabilities discovered during 2025 took an average of 54.81 days to remediate, leaving exploitable application weaknesses open for nearly eight weeks on average.
- In the 2026 breach analysis, organizations fully remediated only 26% of critical known-exploited vulnerabilities during 2025, down from 38% in the preceding dataset.
- The median time to fully resolve those critical vulnerabilities rose to 43 days, compared with 32 days previously, an increase of 11 days.
- At the median, organizations also faced 50% more critical vulnerabilities to patch than in the preceding reporting dataset, increasing pressure on remediation teams.
- The remediation rate therefore fell by 12 percentage points, from 38% to 26%, at the same time that vulnerability workloads increased.
- The median remediation interval increased by about 34%, from 32 to 43 days, showing that higher vulnerability volume coincided with slower complete resolution.
- Federal remediation policy requires covered agencies to fix vulnerabilities in the Known Exploited Vulnerabilities Catalog by their specified due dates. For example, vulnerabilities added on Aug. 12, 2025, entered the catalog only after evidence of active exploitation was established.
- A Jan. 14, 2025, actively exploited Windows vulnerability carried a 21-day remediation window, with a required due date of Feb. 4 for covered federal systems.
- Critical-infrastructure organizations enrolled in federal vulnerability scanning had already demonstrated a declining average number of known-exploited vulnerabilities on internet-accessible assets, supporting the use of exploitation evidence to focus remediation work.
Vulnerability Detection and Audit Statistics
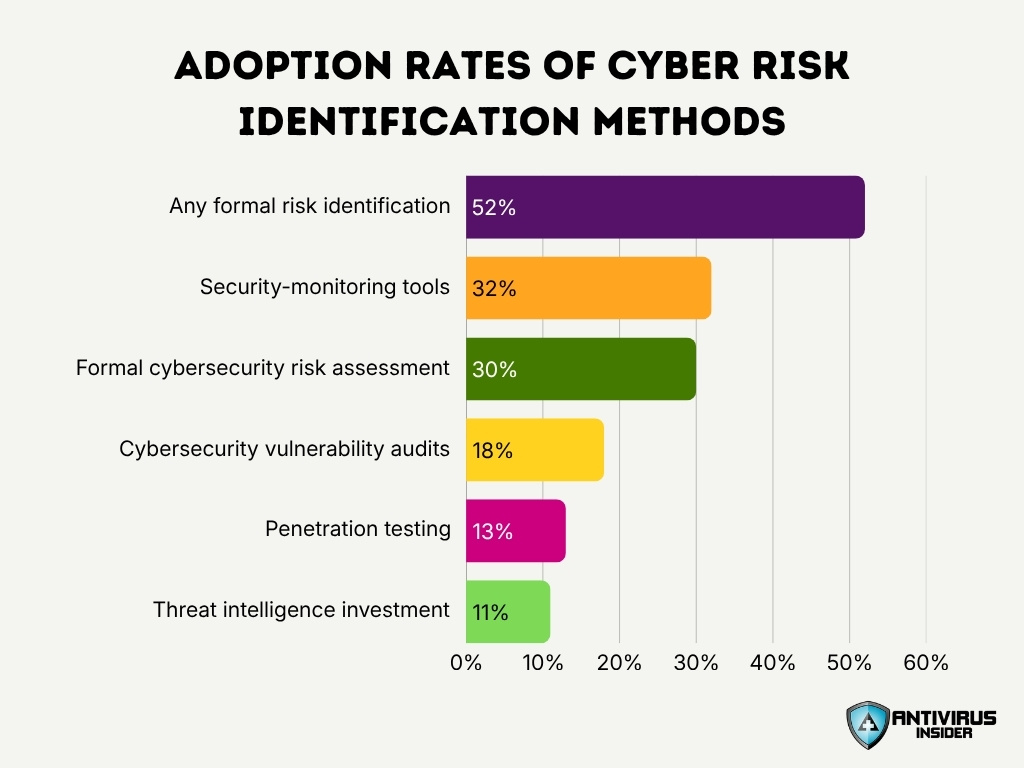
- In a 2025-2026 organizational survey, 52% of businesses conducted at least one formal activity to identify cyber risks, compared with 49% in the previous reporting period.
- Security-monitoring tools were used by 32% of businesses, making monitoring the most frequently reported technical risk-identification activity.
- Only 30% of businesses conducted a formal cybersecurity risk assessment during the previous 12 months.
- Cybersecurity vulnerability audits were conducted by just 18% of businesses, while the rate among charities stood at 10%.
- Penetration testing reached only 13% of businesses and 7% of charities during the 2025-2026 reporting period.
- Threat intelligence received investment from 11% of businesses, indicating that relatively few organizations systematically incorporated external threat information into risk identification.
- Among businesses conducting vulnerability audits, 39% relied exclusively on an external audit, while 28% performed only internal audits and another 28% used both approaches.
- Large businesses showed substantially greater audit maturity; 57% of large organizations conducting vulnerability audits used both internal and external assessments.
- Among organizations that performed audits, 77% examined whether a cybersecurity strategy existed, while 65% assessed active board involvement in cybersecurity discussions.
- A separate 2026 penetration-testing dataset covering 6.8 million findings reported that 91% of critical findings had no CVE, vendor patch, or established remediation playbook, illustrating why CVE-based scanning alone cannot identify every serious security weakness.
Vulnerability Management and Prioritization Statistics
- High- and critical-severity vulnerability disclosures reached 8,539 in Q2 2026, almost exactly twice the 4,268 reported in Q2 2025.
- Despite that doubling in severe disclosures, newly exploited vulnerabilities increased only 8% to 40 during Q2 2026, demonstrating why severity alone does not provide an efficient remediation queue.
- A long-term analysis covering 253,912 CVEs disclosed from 2018 through mid-July 2026 found 3,769 with confirmed exploitation, or about 1.48% of the total.
- Within that exploited set, 81.1% were n-day vulnerabilities, meaning attackers exploited them after a patch had become available rather than before disclosure.
- The median gap between patch availability and observed exploitation for those n-day vulnerabilities was 116 days, giving defenders a measurable but limited opportunity to remediate before attacks emerged.
- Only 711 vulnerabilities in that multi-year dataset qualified as zero-days, further showing that already disclosed and patchable flaws make up most confirmed exploitation.
- In 2025, more than 26% of CVEs carrying 2025 identifiers had public proof-of-concept code or exploit details by year-end, yet only about 1% had confirmed real-world exploitation.
- Enterprise applications represented 48.1% of known-exploited vulnerability entries added since January 2025 in one August 2026 technology-segment analysis, while network edge and security appliances represented 20.7%.
- Operating systems and hypervisors represented 15.5% of recently added exploited vulnerabilities, while vendor platforms and productivity software accounted for 12%, helping security teams identify technology classes that warrant greater attention.
- Network edge and security appliances had a 23.5% ransomware-linked share across their lifetime exploited-vulnerability entries, while operating systems and hypervisors reached 24.7%, illustrating why asset role and attack context should complement raw severity scores.
Human Factor and Access-Related Vulnerabilities
- The human element appeared in 62% of breaches analyzed for 2026, up from 60% in the previous year’s dataset.
- Social engineering represented 16% of all breaches in the 2026 analysis, ranking as the third-most-common breach pattern.
- Phishing remained involved in 16% of breaches, while pretexting accounted for another 6% as attackers increasingly built convincing scenarios around trusted relationships.
- Simulated phishing campaigns showed that successful click rates through mobile-centric channels were 40% higher than through email, highlighting growing exposure through voice and text messaging.
- Financial and insurance organizations recorded a 65% human-element rate in 2026, alongside 34% third-party involvement.
- Healthcare recorded a 54% human-element rate, with staff errors, phishing and misconfigurations continuing to contribute to breaches.
- Manufacturing recorded human involvement in 56% of breaches, while vulnerability exploitation initiated 38% of breaches in that industry.
- Employee use of unapproved AI applications reached 45% in 2026, roughly triple the previous level, creating additional exposure to sensitive-data leakage and weak access governance.
- Among organizations that experienced AI-related security incidents in 2025, 97% lacked adequate AI access controls, linking identity governance directly with emerging AI security risk.
Financial Impact of Vulnerabilities Statistics
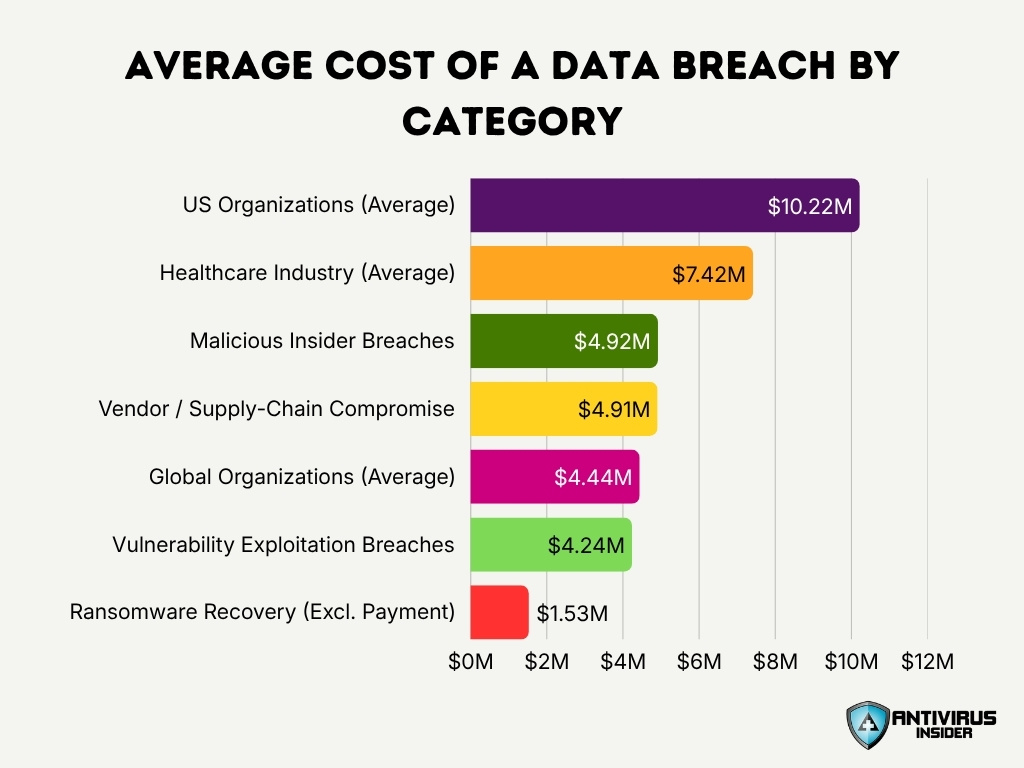
- The average global cost of a data breach reached $4.44 million in 2025, down 9% from $4.88 million in 2024 and marking the first global decline in five years.
- US organizations faced an average breach cost of $10.22 million in 2025, establishing a new record and more than doubling the global average.
- Healthcare remained the costliest industry for breaches at $7.42 million on average, despite a $2.35 million reduction from its 2024 level.
- Breaches originating through vulnerability exploitation cost organizations an average of approximately $4.24 million in the 2025 dataset.
- Third-party vendor and supply-chain compromise generated average breach costs of $4.91 million, placing supply-chain exposure among the most financially damaging entry paths.
- Malicious insider breaches averaged $4.92 million, the highest average cost among the initial attack vectors analyzed in 2025.
- Average ransomware recovery costs fell 44% to $1.53 million in 2025, excluding ransom payments, compared with $2.73 million the year before.
- The average ransom payment declined by 50%, from $2 million to $1 million, between the 2024 and 2025 ransomware studies.
- Organizations that identified breaches internally saved about $900,000 per incident compared with organizations whose breach was disclosed by an attacker.
- Extensive use of AI and automation in security correlated with approximately $1.9 million in breach-cost savings compared with organizations that did not make extensive use of these technologies.
Mobile and IoT Vulnerability Statistics
- A 2026 security analysis examined more than 150,000 mobile applications scanned during 2025 across Android and iOS ecosystems.
- High-severity CVEs appeared in 65% of Android applications, compared with 14% of iOS applications.
- Critical-severity CVEs appeared in 11% of Android apps and 13% of iOS apps, showing that severe third-party dependency risk affects both major mobile platforms.
- Researchers found 1,096 Android applications still containing a critical vulnerability originally disclosed in 2017.
- Another 2,075 iOS applications contained a critical vulnerability first disclosed in 2023, demonstrating that recent flaws can remain embedded across large app populations.
- Researchers observed 815,735 new unique mobile installation packages during 2025, although the total fell by almost one-third from the preceding year.
- Internet monitoring recorded approximately 701 billion cyberattack-related packets during 2025, about 2.2% more than in 2024, with connected-device targeting remaining a major source of hostile activity.
- Researchers estimated that around 60,000 IoT devices worldwide may have become infected with one specific botnet during 2025.
- A smart-home dataset covering 6 million households recorded 4.6 billion vulnerability-exploitation attempts against live IoT targets and an average of 29 attacks per connected home every day.
- In Q1 2026, US infrastructure generated 23.74% of observed SSH attacks against IoT honeypots, up from 16.10% in Q4 2025.
Emerging Threats and AI-Related Vulnerability Statistics
- 87% of cybersecurity leaders surveyed for the 2026 outlook identified AI-related vulnerabilities as the fastest-growing cyber risk during 2025.
- 94% of respondents expect AI to become the most significant force changing cybersecurity during 2026.
- The share of organizations formally assessing AI security increased from 37% in 2025 to 64% in 2026, an increase of 27 percentage points.
- Despite that progress, roughly one-third of organizations still lacked a process for assessing AI security before deployment in the 2026 survey.
- Valid AI-related vulnerability reports increased 210% during 2025, while prompt-injection reports rose 540%.
- High-risk generative AI prompts containing sensitive or regulated information increased from 2% to 4% over a year, effectively moving from about one risky interaction in 50 to one in 25.
- Organizations used an average of 10 different AI applications per month, increasing the number of external AI services through which corporate information could potentially leak.
- Long malicious prompt-injection payloads increased approximately fivefold between March and May 2026 and approached 1% of observed prompts by May.
- 16% of breaches studied in 2025 involved attackers using AI tools, most commonly for phishing and deepfake-based impersonation.
- Threat actors studied for the 2026 breach analysis used AI assistance across a median of 15 attack techniques, while some actors applied it to 40 or 50 documented techniques.
AI-Driven Cyberattack Methods and Their Impact
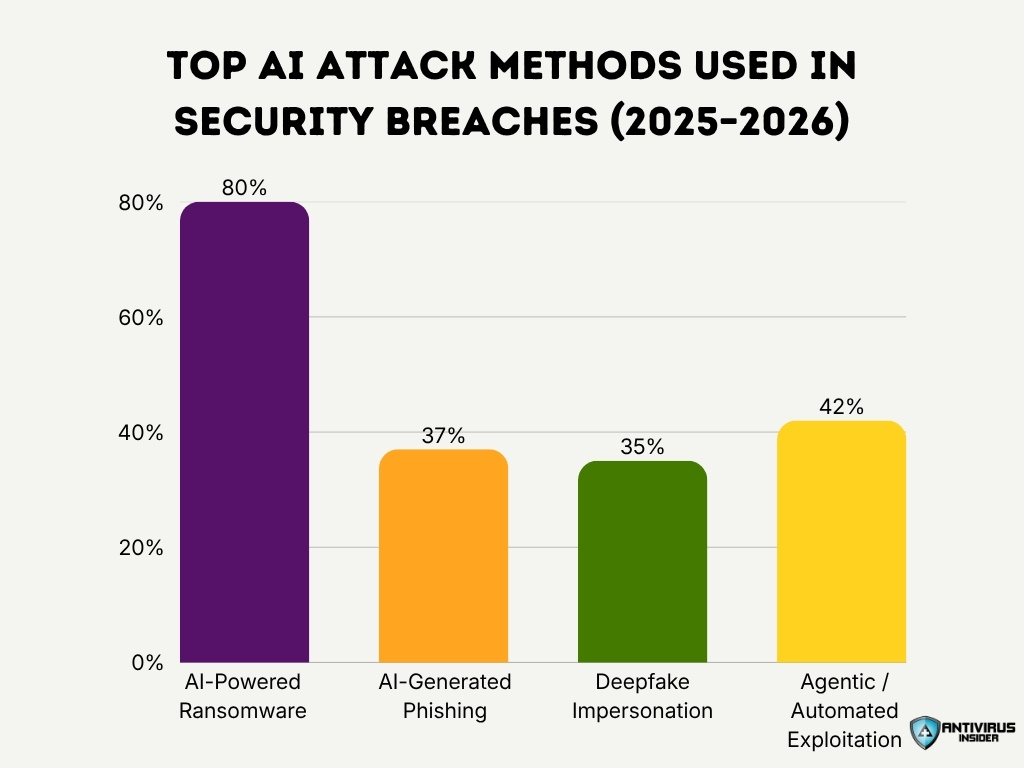
- AI-powered ransomware leads AI-related attack methods at 80%, highlighting how automation is increasingly used for payload generation and security evasion.
- Agentic and automated exploitation could account for a projected 42% of phishing activity, enabling attackers to conduct real-time, context-aware vulnerability probing.
- AI-generated phishing represents 37% of AI-involved breaches, while AI-crafted campaigns can achieve a 54% click rate at 95% lower cost.
- Deepfake impersonation accounts for 35% of AI-involved breaches, creating additional risks for identity verification and voice authentication systems.
- Overall, the figures suggest attackers are using AI to automate, scale and personalize cyberattacks, making ransomware, phishing and impersonation more efficient.
Future Cyber Security Vulnerability Trends
- Updated modeling projects approximately 66,000 CVE disclosures during 2026, putting annual vulnerability publication on course to approach 70,000 for the first time.
- Midyear 2026 vulnerability disclosures were running 46.3% above projections made only four months earlier, showing how rapidly vulnerability discovery capacity has expanded.
- AI is expected to drive the greatest cybersecurity change during 2026 according to 94% of surveyed leaders, increasing both automated defense and attacker capability.
- Generative AI data leakage emerged as the top AI-related concern for 34% of respondents in 2026, compared with 22% in the previous year’s outlook.
- Concern about advancing adversarial AI capabilities decreased from 47% in 2025 to 29% in 2026, indicating a shift from theoretical attacker capability toward immediate data-governance exposure.
- 40% of organizations now periodically review AI tools before deployment, compared with 24% that rely on a one-time assessment.
- Geopolitically motivated cyberattacks now influence cyber-risk mitigation strategies at 64% of organizations, linking vulnerability management increasingly with nation-state and critical-infrastructure risk.
- Third-party involvement reached 48% of breaches in 2026, after increasing 60% year over year, suggesting that supplier and software ecosystem exposure will remain a major vulnerability-management priority.
- AI-driven automated traffic associated with attacks grew at roughly 21% month over month in the 2026 breach analysis, reinforcing expectations that organizations will face increasingly machine-speed reconnaissance and exploitation.
Frequently Asked Questions (FAQs)
A total of 35,885 CVE records were published in Q1 and Q2 2026, including 15,176 in Q1 and 20,709 in Q2.
Vulnerability exploitation accounted for 31% of breaches, making it the leading initial-access vector in the 2026 dataset.
Organizations fully remediated only 26% of critical known-exploited vulnerabilities, down from 38% previously.
Researchers tracked 90 zero-day vulnerabilities exploited in the wild during 2025, up from 78 in 2024.
The global average data breach cost was approximately $4.4 million, representing a 9% year-over-year decrease.
Conclusion
Cybersecurity vulnerability statistics point to a larger and more complex attack surface, faster exploitation cycles, and growing pressure on security teams to identify and remediate the flaws that matter most. Vulnerabilities now span traditional enterprise software, cloud platforms, mobile applications, IoT devices, third-party dependencies, and AI-enabled systems, while attackers increasingly combine technical weaknesses with stolen credentials and social engineering. At the same time, real-world exploitation remains concentrated in a relatively small share of disclosed vulnerabilities, making risk-based prioritization more effective than treating every CVE with equal urgency.
Organizations can reduce exposure by combining continuous vulnerability discovery, exploitation intelligence, rapid patching, stronger identity controls, and regular testing of critical assets. As vulnerability volumes continue to rise, the ability to distinguish theoretical weaknesses from actively exploitable risk will become even more important for effective cybersecurity management.
