



Cookies remain a core part of how websites manage sessions, remember user preferences, measure traffic, and support digital advertising. Their role is changing as browsers tighten tracking controls, regulators enforce stricter consent rules, and businesses rely more on first-party data and privacy-focused technologies. E-commerce sites use cookies to preserve shopping carts and login sessions, while publishers and advertisers use them to measure campaigns, personalize content and understand audience behavior. These shifts make cookie usage, consent rates and browser policies important indicators of how the web is balancing functionality with privacy.
Editor’s Choice
- 60% of cookies observed on mobile pages in the 2025 top-million dataset were third-party cookies; desktop pages recorded a similar 59% share.
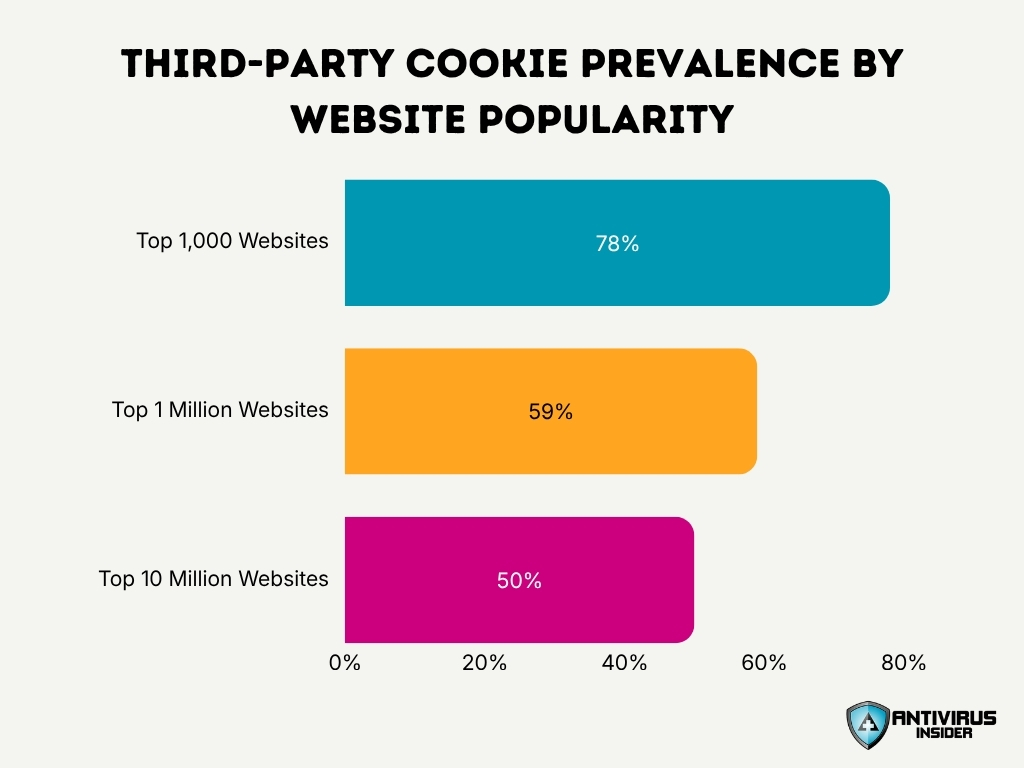
- On the top 1,000 most visited websites, third-party cookies accounted for about 78% of cookies, indicating that heavily trafficked sites tend to depend more strongly on third-party services.
- The median website set nine cookies, but the 90th-percentile desktop page set 44 cookies, and the 99th percentile approached 395 cookies.
- Nearly 9% of third-party cookies were partitioned on mobile pages in July 2025, up from about 6% in the previous year’s dataset.
- About 19% of first-party cookies were session cookies, versus only 7% of third-party cookies on desktop, showing that third-party cookies tend to persist longer.
- Nearly 100% of observed third-party cookies used
SameSite=None, allowing them to travel with cross-site requests where browser policies permit. - One 2025 analysis of more than 1 million websites found that nearly half used tracking cookies without valid prior consent, highlighting the continuing compliance gap around web tracking.
Recent Developments
- In April 2025, the planned rollout of a new standalone third-party-cookie choice prompt in Chrome was abandoned, leaving the browser’s existing cookie controls in place instead of introducing the previously proposed prompt.
- As a result, Chrome did not proceed with a broad phaseout of third-party cookies as previously planned, materially changing the expected timeline for advertisers, publishers, and analytics providers.
- The change helped explain why third-party cookies still represented approximately 60% of observed cookies in the July 2025 top-million web dataset.
- In 2025, nearly 9% of third-party cookies used partitioned storage on mobile pages, compared with about 6% a year earlier. Partitioning limits a third-party cookie to the top-level website where it was created.
- However, adoption remained uneven: only about 1% of first-party cookies appeared with the partitioned attribute in the same dataset.
- Web standards work also continued into 2026. A new cookies specification draft published on May 21, 2026, proposed an updated HTTP state-management mechanism and was being developed as a standards-track document.
- Another cookie specification revision had entered the publication process after approval as a proposed standard, showing that cookie behavior, security attributes, and interoperability remain active standards issues rather than settled technology.
- Regulatory pressure has also produced measurable changes. A 2025 enforcement review found 979 of 1,000 major websites met its cookie-compliance checks during their most recent assessment, while 21 still failed.
What Are Cookies?
Cookies are small pieces of text that websites ask browsers to store. They help otherwise stateless HTTP connections remember information between page requests, which supports tasks such as maintaining logins, retaining settings, keeping carts intact, and measuring activity.
- The current HTTP standards work defines cookies through two primary header fields:
Set-CookieandCookie. Servers use the first to store information in a browser, while browsers return eligible cookies through later requests. - Cookie-based state solves a core web limitation: HTTP requests are otherwise largely stateless, meaning one request does not automatically remember the previous one.
- A typical cookie is compact. Across the 2025 top-million dataset, the median size was 40 bytes on both desktop and mobile pages.
- Browser and protocol limits keep cookies relatively small. The largest observed cookies reached about 4 KB, consistent with widely implemented cookie-size limits.
- Cookies can carry session identifiers that let users stay authenticated across multiple HTTP requests, which makes them important for login systems and account-based services.
- The same ability creates security risk. If an attacker obtains an authentication cookie, the cookie can potentially support session hijacking unless the website applies appropriate protections.
- Cookies can also enable tracking. A third-party service embedded across multiple websites can recognize a stored identifier when the same browser encounters that service elsewhere.
- First-party cookies are not automatically privacy-neutral. Tracking systems can also use first-party identifiers and techniques such as cookie syncing to connect activity across services.
Types of Cookies
Cookies can be categorized by who sets them, how long they last and which security or cross-site restrictions apply.
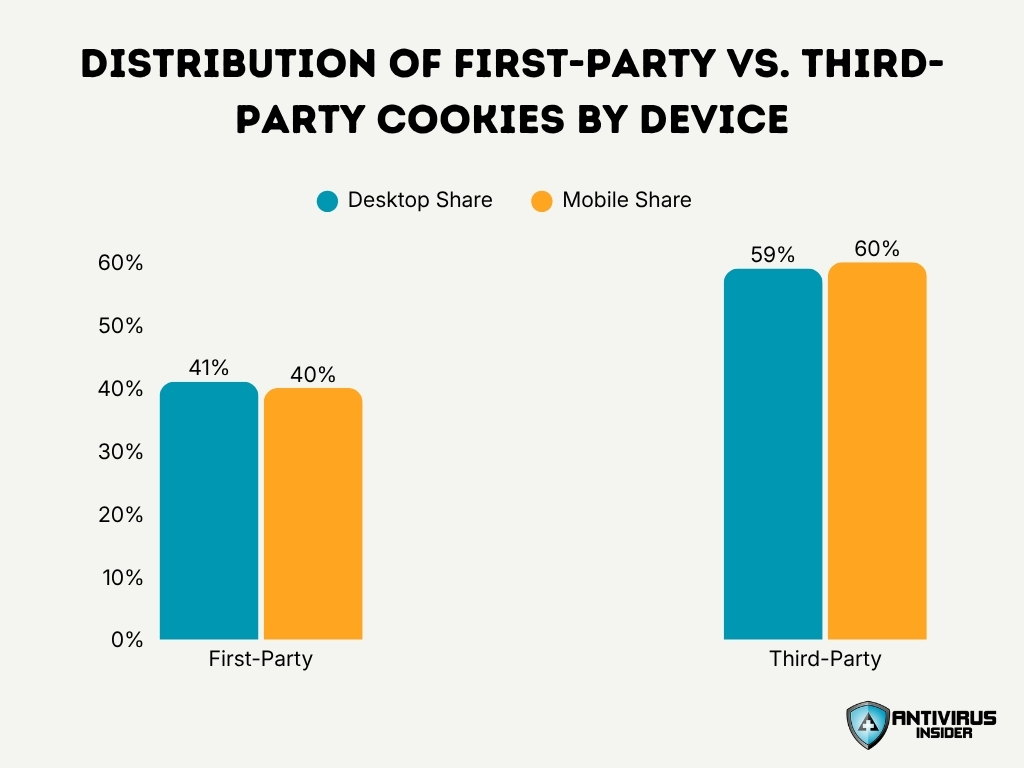
- First-party cookies originate in the context of the website a person visits directly. They accounted for 41% of observed desktop cookies and 40% of mobile cookies in the 2025 dataset.
- Third-party cookies originate from another domain embedded on the visited page. They represented 59% of desktop cookies and 60% of mobile cookies.
- Session cookies expire after the relevant browsing session ends. About 19% of first-party desktop cookies fell into this category, compared with 7% of third-party cookies.
- Persistent cookies survive beyond one browsing session. Their importance remains significant because the median lifetime of non-session cookies in the dataset was roughly 12 months.
- Partitioned cookies isolate third-party state by top-level site, reducing the ability to reuse the same identifier across unrelated websites. Nearly 9% of observed third-party cookies on mobile used partitioning in July 2025.
- HttpOnly cookies cannot normally be read through JavaScript, reducing exposure to certain script-based attacks. About 12% of first-party cookies and slightly more than 26% of third-party cookies used this attribute.
- Secure cookies travel only through HTTPS requests. About 24% of first-party cookies in the 2025 dataset explicitly used the Secure attribute.
- Cookies can also use
SameSitecontrols. On desktop, 19% of first-party cookies usedSameSite=Lax, 3% usedStrict, 11% usedNoneand 66% did not explicitly specify the attribute.
How Cookies Work
- In 2025, roughly 19% of first-party desktop cookies used the SameSite=Lax setting.
- Nearly 100% of observed third-party cookies utilized the SameSite=None value.
- The HttpOnly attribute appeared on approximately 12% of first-party cookies.
- Between 26% and 28% of third-party cookies actively used the HttpOnly attribute.
- The total share of partitioned third-party cookies on mobile pages was roughly 6% in 2024.
- By 2025, partitioned third-party cookies on mobile pages increased to nearly 9%.
- The median expiration for all persistent cookies on desktop was 364 days.
- The median expiration for all persistent cookies on mobile was 360 days.
Cookie Usage Statistics
- A 2026 technology-detection survey identified cookies on 41.8% of websites. Because automated crawlers do not trigger every login, checkout, or interactive workflow, this measure should not be interpreted as the percentage of all sites capable of setting cookies.
- Across the top 1 million websites studied in July 2025, 59% of desktop cookies and 60% of mobile cookies were third-party.
- The median desktop website set nine cookies overall, including medians of seven first-party and seven third-party cookies among pages where those types appeared.
- Mobile pages also recorded a median of nine cookies overall, with six first-party and four third-party cookies at the median.
- Cookie counts rise sharply toward the upper end of the distribution. The 90th-percentile desktop page set 44 cookies, while the 99th percentile reached about 395.
- The most cookie-heavy desktop page in the dataset contained 915 cookies, including a maximum observation of 885 third-party cookies on an individual page.
- Website popularity strongly correlates with third-party cookie concentration: about 78% of cookies on top-1,000 sites were third-party, compared with roughly 59% to 60% across the top million.
- Advertising-related third parties appeared on approximately 59% of web pages in a 2025 privacy analysis, while analytics-related tracking services appeared on 64% of desktop pages under a separate functional classification.
- One large e-commerce study analyzed more than 44,000 cookies across 18 countries and classified 43% as third-party cookies; 73% of those third-party cookies qualified as tracker cookies under the study’s methodology.
- Cookie practices continue to differ sharply by market. A 2026 study covering more than 6,000 websites and 84,000 cookies in one major national market classified 82.2% of detected cookies as nonessential, including 38.1% categorized as marketing cookies and 21.7% as analytics cookies.
First-Party vs Third-Party Cookies Statistics
- In July 2025, 41% of desktop cookies were first-party compared to 59% that were third-party.
- On mobile pages, first-party cookies represented 40% while third-party cookies accounted for 60%.
- Among the top 1,000 websites, approximately 78% of cookies were third-party.
- For websites ranked near the top 10 million, third-party cookies accounted for just under half.
- Desktop websites recorded a median of seven for both first-party and third-party cookies.
- On mobile devices, the median was six first-party cookies and four third-party cookies.
- About 19% of first-party desktop cookies were session cookies compared to only 7% for third-party.
- The HttpOnly attribute appeared on 12% of first-party cookies compared to 28% of third-party cookies.
- Only 1% of first-party cookies used partitioning on desktop while 10% of third-party cookies did so.
Third-Party Cookie Usage Trends
- Approximately 60% of all recorded cookies in July 2025 were third-party cookies.
- At least 90% of analyzed web pages in 2025 loaded one or more third-party services.
- Among the top 1,000 sites, third-party requests increased by 15 requests per page compared to 2024.
- Across the broader dataset, third-party requests increased by five requests per page on desktop and mobile.
- Partitioned third-party cookie adoption grew from 6% in 2024 to 8.6% in July 2025.
- About 100% of observed third-party cookies utilized the SameSite=None configuration.
- One widely deployed third-party advertising cookie appeared on more than 35% of pages.
- Another third-party test cookie was present on over one-quarter of the analyzed websites.
Browser Cookie Adoption Rates
- As of July 2026, Chrome represented 68.22% of worldwide browser usage, making its cookie policy especially important to advertisers, analytics providers, and publishers.
- Safari held 16.47% of the global browser market in July 2026 and blocks third-party cookies by default through its cross-site tracking protections.
- Firefox accounted for 3.34% of worldwide browser usage in July 2026 and runs Total Cookie Protection by default, isolating cookies into separate site-specific storage.
- Edge represented 5.37% of global browser usage in July 2026. Its default tracking-prevention model restricts known trackers rather than universally blocking every third-party cookie.
- Samsung Internet accounted for 2.06% of worldwide browsing in July 2026, while Opera held 1.88%. Together, smaller browsers still represented a meaningful share of web traffic outside the four largest products.
- In June 2026, Safari and Firefox together accounted for roughly 18.6% of global browsing, meaning close to one-fifth of worldwide browser traffic came from browsers that strongly isolate or block third-party cookies by default.
- Chrome does not block third-party cookies by default in normal browsing in 2026; users can block them manually, while Incognito mode applies stronger restrictions.
- Safari’s implementation goes further by blocking third-party cookie access by default and requiring controlled mechanisms, such as the Storage Access API, for supported cross-site use cases.
- Firefox’s default system does not simply delete every third-party cookie. Instead, it places cookies into separate site-specific cookie jars, preventing the same identifier from easily tracking a person between unrelated websites.
Cookie Consent Rates by Industry
- Across more than 6,000 websites examined in one 2026 national study, only 4.1% displayed any cookie consent banner, highlighting major regional differences in consent-interface adoption.
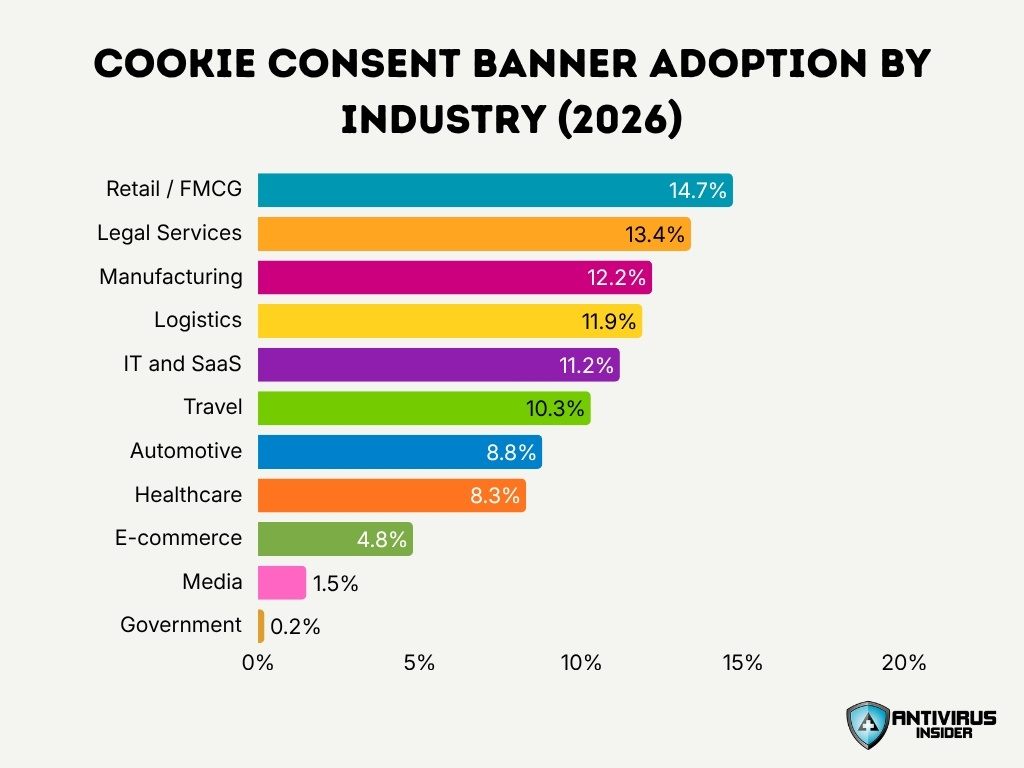
- Retail and fast-moving consumer goods recorded the highest consent-banner adoption among the sectors reported, at 14.7%.
- Legal-services websites followed at 13.4%, putting them ahead of manufacturing, technology and travel websites in consent-interface adoption.
- Manufacturing websites recorded a 12.2% consent rate, while logistics sites reached 11.9%.
- IT and SaaS websites posted an 11.2% consent-banner rate and averaged 15.5 cookies per website.
- Travel websites reached 10.3% consent adoption, while automotive websites recorded 8.8%.
- Healthcare websites reached only 8.3%, despite the potentially sensitive nature of health-related browsing activity.
- E-commerce websites recorded only 4.8% consent-banner adoption in the study and averaged 24 cookies per site.
- Media websites had a consent-banner rate of just 1.5% while averaging 30.4 cookies per page; 70.5% of their cookies were classified as third-party.
- Government websites posted the lowest reported adoption rate at 0.2%, although they also averaged only 3.9 cookies per page and had a smaller third-party-cookie share of 30.1%.
Cookie Banner Compliance Statistics
- By April 2026, 99% of the top 1,000 websites in one major regulated market met official cookie-banner compliance standards following sustained monitoring and intervention.
- In December 2025, 979 of the top 1,000 websites had passed the same regulator’s compliance checks, leaving 21 sites still failing at the time of testing.
- Only 415 of the 979 compliant websites had passed without regulatory intervention; another 564 improved after previously failing compliance checks.
- Regulators issued preliminary enforcement notices in 17 cases after earlier engagement failed to produce sufficient changes.
- At the beginning of 2025, concerns had been communicated to 134 of the top 200 websites already assessed, showing how substantial the initial compliance gap was before the broader enforcement program.
- A separate 2025 academic analysis of the top 10,000 websites across 31 European countries found that 67% displayed consent interfaces.
- However, the same European study classified only 15% of websites as minimally compliant, with missing first-layer rejection options contributing heavily to failures.
- Consent-management platforms supplied approximately 67% of consent interfaces in that study, showing how a relatively small group of technology providers influences banner design at scale.
- Just three organizations collectively accounted for 37% of the consent-management market measured across the 31-country dataset.
- In a separate 2026 study, 79.6% of websites with consent banners placed nonessential cookies before the visitor interacted with the banner, while 62.7% of banners offered an accept-only design.
User Behavior with Cookie Banners
- Behavioral research found that when a first-layer banner omitted a visible reject button, only 4% of participants refused cookies in one tested design.
- When the banner displayed both choices but visually emphasized the accept option, the refusal rate increased to approximately 18%.
- A neutral banner with equally presented choices also produced a refusal rate of around 18% in the same experiment, demonstrating how interface structure can affect behavior.
- Across prior controlled studies, cookie banners with equally styled accept and reject buttons produced acceptance rates ranging from approximately 53% to 72%.
- Research reviewing banners without a first-layer reject option found acceptance rates ranging from 77% to 95.8%.
- One study found that removing an explicit rejection button from the first banner layer increased the probability of consent by approximately 30 percentage points.
- A survey of 2,316 adults found that just 21% had noticed recent changes that made rejecting all cookies easier, while 58% had noticed no such improvement.
- Only 13% of surveyed adults said they felt they had significant control over cookies and online tracking, while 41% reported having little or no control.
- In the same survey, 44% of adults said they had provided more personal information than they wanted at least once a week to access a site or app, with accepting tracking cookies included as an example.
- About 21% reported doing so daily, illustrating how frequently privacy decisions appear during everyday online activity.
How Americans Handle Website Cookie Settings
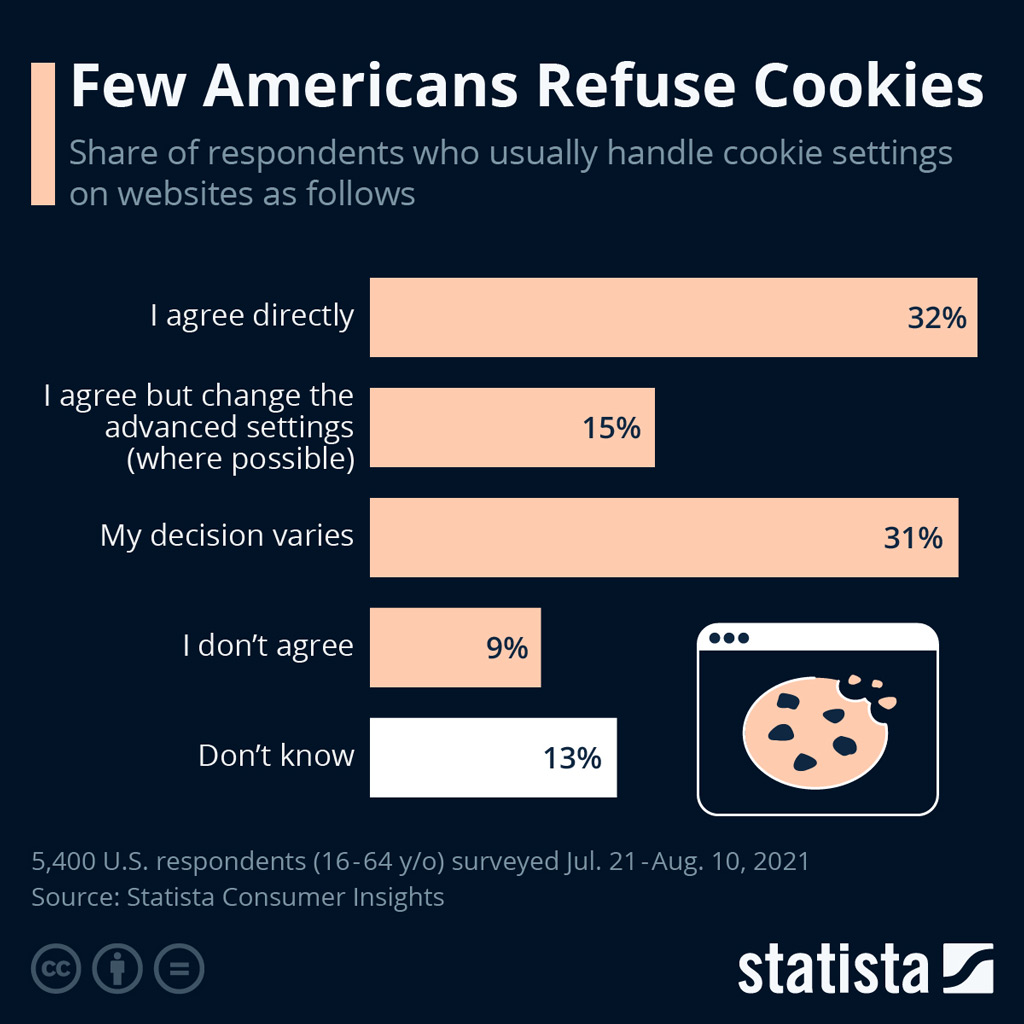
- 32% of Americans agree to cookies directly, making immediate acceptance the most common response among those surveyed.
- Nearly as many, 31%, said their decision varies, showing that cookie consent often depends on the website or situation.
- Another 15% agree to cookies but adjust advanced settings where possible, indicating a more selective approach to online tracking.
- Only 9% of respondents refuse cookies outright, making complete rejection the least common behavior in the survey.
- Meanwhile, 13% said they don’t know how they typically handle cookie settings, suggesting some uncertainty around consent choices.
- Combined, 47% of respondents accept cookies either directly or after changing settings, compared with just 9% who consistently refuse them.
Cookie Consent Opt-Out Rates
- In one behavioral experiment, only 4% of users opted out when the cookie banner lacked an immediate first-layer reject button.
- Adding a visible rejection option increased the measured refusal rate to approximately 18%, more than four times the rate observed in the accept-focused design.
- Across multiple academic studies with balanced accept and reject options, implied opt-out rates ranged from roughly 28% to 47%, based on reported acceptance rates of 53% to 72%.
- When users had to enter a second layer to reject cookies, acceptance rates reached 77% to 95.8%, implying rejection rates as low as about 4.2% in some designs.
- In a 2025 study of “pay or consent” interfaces, some implementations achieved consent rates as high as 99.9%, leaving only a tiny fraction of visitors choosing the nontracking alternative under those conditions.
- Older enforcement data found that 81% of more than 500 examined pages did not initially provide a first-layer reject option, showing why measured opt-out behavior cannot be separated from interface design.
- The same enforcement project found that 73% used visual contrast or color choices that favored acceptance, while 90% did not provide an easy mechanism to withdraw consent.
- A 2025 tracking study covering more than 20,000 domains found that turning on Global Privacy Control reduced certain persistent tracking cookies by an average of 30%.
- Explicitly rejecting banners on later visits produced an additional 32% reduction in those cookies, showing that active refusal can reduce tracking even when browser-level privacy signals are already enabled.
- Yet approximately 50% of websites in that study still transmitted at least one previously established tracking cookie under the stateful browsing conditions tested, demonstrating why opting out does not always eliminate all cross-site data flows.
GDPR and Cookie Law Compliance Rates
- By December 2025, 979 of the top 1,000 websites assessed in one major European market passed official checks covering advertising-cookie consent and rejection.
- Only 21 of the 1,000 sites remained noncompliant at their latest test, putting the measured pass rate at 97.9%.
- Of the 979 compliant sites, just 415 passed without regulatory intervention, meaning most required some form of corrective engagement.
- Another 564 websites changed their practices after initially failing and receiving direct regulatory contact.
- Regulators escalated 17 cases to preliminary enforcement notices when earlier engagement failed to produce adequate changes.
- The compliance initiative increased meaningful tracking controls for an estimated 40 million internet users, representing about 80% of internet users age 14 and older in that market.
- A separate 2025 study of more than 1 million websites found that nearly half deployed tracking cookies without valid prior consent, showing that global compliance remains substantially weaker than the best-performing enforcement samples.
- The 31-country European study found that 67% of consent interfaces were supplied by consent management platforms, and differences between those platforms explained about 18% of the measured compliance variance.
- Three organizations controlled approximately 37% of the measured consent-management market, giving a small number of intermediaries significant influence over how millions of consent choices appear to users.
- Cookie and privacy enforcement remained financially significant in 2025: one national regulator issued 83 sanctions totaling €486.84 million, with cookies among the main subjects of enforcement.
Cookie Rejection Creates Major Analytics Blind Spots
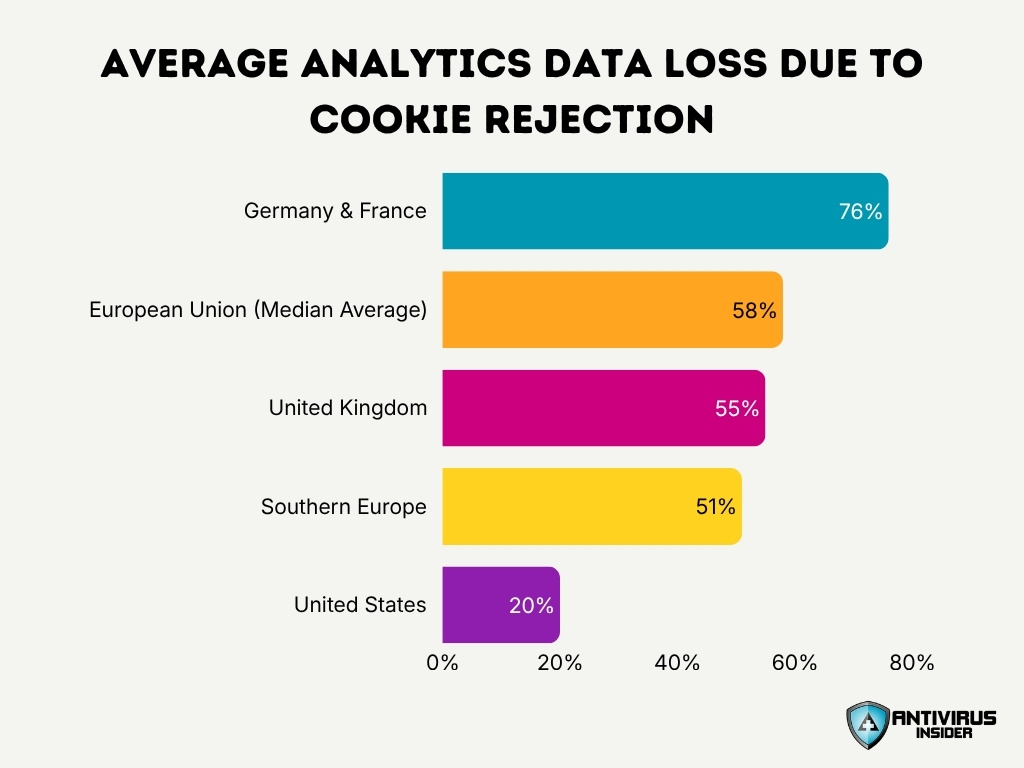
- Germany and France record the highest analytics data blind spot at 76%, indicating that cookie rejection can leave businesses with visibility into less than one-quarter of user activity.
- The European Union’s median average analytics data loss reaches 58%, highlighting the substantial measurement challenges created by strict privacy rules and consent behavior.
- The United Kingdom experiences an average analytics blind spot of 55%, meaning more than half of potential website activity may not appear in conventional cookie-based reports.
- Southern Europe records a 51% analytics data blind spot, placing the region slightly below the EU median but still above the halfway mark.
- The United States has the lowest estimated data blind spot at 20%, which is 56 percentage points lower than the rate recorded across Germany and France.
- Overall, the figures show that cookie rejection has a much greater impact on analytics coverage in European markets, where estimated data loss ranges from 51% to 76%, compared with 20% in the United States.
Privacy Sandbox and Cookie Alternatives Statistics
- By October 2025, 10 major Privacy Sandbox technology groups were identified for retirement.
- In Q1 2025, Protected Audience auction latency improved by 35% year-over-year.
- Mobile page adoption of partitioned cookies increased from 6% in 2024 to 8.6% in 2025.
- On October 17, 2025, Privacy Sandbox on Android alongside 6 mobile ad tools was marked deprecated.
- As of August 14, 2026, 5 core web ad technologies were listed for formal deprecation and removal.
- In April 2025, rollout plans for a standalone third-party cookie choice prompt were officially dropped.
- By Q2 2025, industry integrations declined due to limited advertiser demand and high operating costs.
- Exactly 4 browser identity and isolation standards, including CHIPS and FedCM, remain supported.
Impact of Cookie Restrictions on Advertising
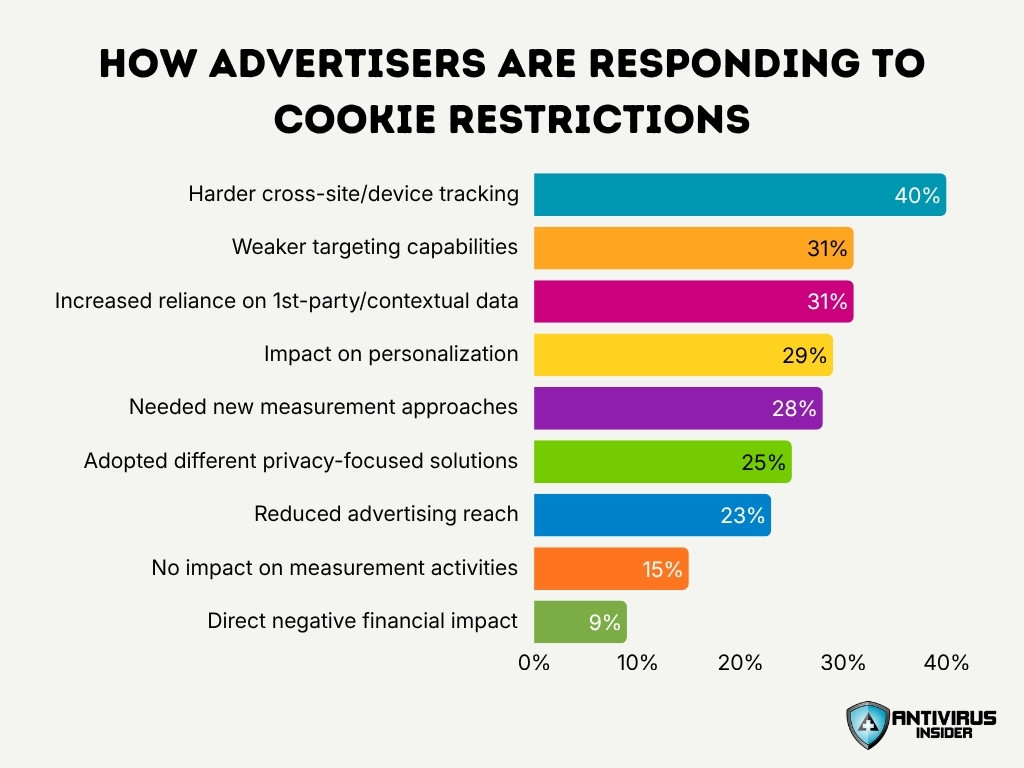
- In a 2025 programmatic-advertising survey, 40% of respondents said third-party cookie restrictions had made cross-site, cross-platform and cross-device tracking more difficult.
- 31% reported weaker targeting capabilities, showing that loss of cross-site identifiers continues to affect audience selection.
- Another 31% said restrictions increased their reliance on first-party data and contextual advertising, pushing companies toward information collected directly from customers and page content.
- About 29% reported an impact on personalization, as reduced identity signals make it harder to tailor advertising consistently across websites and devices.
- 28% said they needed new measurement approaches to assess programmatic performance after traditional cookie signals weakened.
- Another 25% adopted different privacy-focused solutions, reflecting continued investment in alternative measurement and identity technology.
- Cookie restrictions reduced advertising reach for 23% of respondents, while only 15% said third-party cookie deprecation had produced no impact on their measurement activities.
- A smaller but financially significant 9% reported a direct negative financial impact from third-party cookie deprecation.
- A 2025 economic simulation estimated that a complete third-party-cookie ban could reduce publisher advertising revenue by about 30% and advertiser surplus by 16% under the researchers’ modeled market conditions.
- Earlier empirical evidence reviewed in subsequent economic research found that behavioral advertising could command CPMs of $4.12, compared with $1.98 for untargeted network advertising, illustrating the historical monetary value attached to tracking data.
Mobile vs Desktop Cookie Usage
- At the 75th percentile, desktop pages set 23 cookies, compared with 22 cookies on mobile pages.
- At the 90th percentile, cookie counts reached 44 on desktop and 43 on mobile, indicating little device-level difference for most heavily instrumented sites.
- At the 99th percentile, mobile pages actually edged ahead with 396 total cookies, compared with 395 on desktop.
- The most extreme desktop page contained 915 cookies, while the mobile maximum reached 831, a difference of 84 cookies.
- The maximum third-party-cookie count reached 885 on desktop, compared with 801 on mobile, suggesting that desktop experiences can reach higher extremes of third-party integration.
- At the 90th percentile, cookie size reached 149 bytes on desktop and 150 bytes on mobile, showing almost identical storage profiles across device classes.
- At the 99th percentile, however, mobile cookies reached 388 bytes, compared with 338 bytes on desktop.
- Third-party cookies had a median lifetime of 360 days on desktop but 270 days on mobile, while first-party cookies had a median lifetime of 365 days on both.
- Third-party
HttpOnlyadoption reached 28% on desktop and 26% on mobile, while first-party adoption remained 12% on both device classes. - Beyond cookies alone, at least one recognized third-party tracker appeared on 75% of desktop pages and 74% of mobile pages in the 2025 dataset.
Frequently Asked Questions (FAQs)
About 60% of cookies observed across the top 1 million websites are third-party cookies, compared with roughly 40% that are first-party cookies.
The median website sets 9 cookies, while desktop sites at the 90th percentile set 44 cookies and those at the 99th percentile set about 395.
As of April 2026, 99% of the top 1,000 websites assessed in a major regulated market met the applicable cookie-banner compliance standards.
A study covering 254,148 websites across 31 European countries found that 67% used consent interfaces, but only 15% met minimum compliance criteria.
About 8.6% of third-party cookies on mobile pages used partitioned storage in July 2025, up from roughly 6% a year earlier.
Conclusion
Cookies continue to play a major role in website operations, even as the industry moves away from unrestricted cross-site tracking. Third-party cookies still represent a large share of observed cookie activity, but browser protections, consent requirements and partitioned storage are changing how those cookies work. At the same time, first-party data, contextual advertising and privacy-preserving technologies are becoming more important for marketers, publishers and online platforms.
The data also shows that regulation and interface design strongly influence user choice. Websites with clear reject options record higher opt-out rates, while regulatory intervention has significantly improved compliance among major sites in some markets. Overall, the web is not becoming fully cookieless. Instead, it is moving toward a model where tracking is more controlled, transparent, and dependent on consent, browser settings, and first-party relationships.
